
Page 504 -
P. 504
Chapter 12 Enhancing Decision Making 503
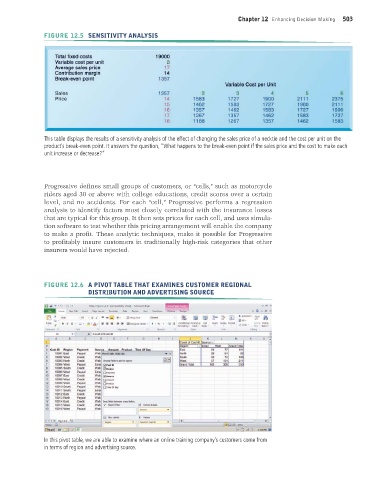
FIGURE 12.5 SENSITIVITY ANALYSIS
This table displays the results of a sensitivity analysis of the effect of changing the sales price of a necktie and the cost per unit on the
product’s break-even point. It answers the question, “What happens to the break-even point if the sales price and the cost to make each
unit increase or decrease?”
Progressive defines small groups of customers, or “cells,” such as motorcycle
riders aged 30 or above with college educations, credit scores over a certain
level, and no accidents. For each “cell,” Progressive performs a regression
analysis to identify factors most closely correlated with the insurance losses
that are typical for this group. It then sets prices for each cell, and uses simula-
tion software to test whether this pricing arrangement will enable the company
to make a profit. These analytic techniques, make it possible for Progressive
to profitably insure customers in traditionally high-risk categories that other
insurers would have rejected.
FIGURE 12.6 A PIVOT TABLE THAT EXAMINES CUSTOMER REGIONAL
DISTRIBUTION AND ADVERTISING SOURCE
In this pivot table, we are able to examine where an online training company’s customers come from
in terms of region and advertising source.
MIS_13_Ch_12 global.indd 503 1/17/2013 2:30:32 PM