Page 205 - Managing Global Warming
P. 205

Current and future nuclear power reactors and plants              167

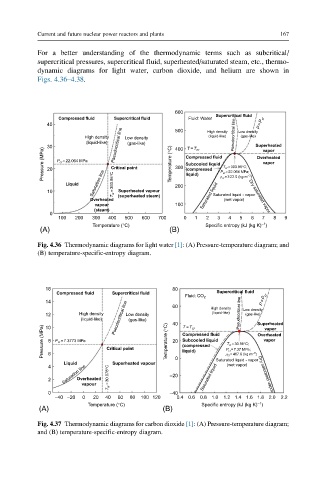
           For a better understanding of the thermodynamic terms such as subcritical/
           supercritical pressures, supercritical fluid, superheated/saturated steam, etc., thermo-
           dynamic diagrams for light water, carbon dioxide, and helium are shown in
           Figs. 4.36–4.38.


                                                600
                 Compressed fluid  Supercritical fluid  Fluid: Water  Supercritical fluid
              40                                500                    P=P cr
                                                         (liquid-like)
                                                                  (gas-like)
                        High density  Low density        High density Pseudocritical line  Low density
                        (liquid-like)  (gas-like)
              30                Pseudocritical line  400  T=T cr      Superheated
             Pressure (MPa)  20  P cr = 22.064 MPa  Critical point  Temperature (°C)  300  Compressed fluid P cr = 22.064 MPa;  Overheated
                                                                        vapor
                                                                        vapor
                                                   Subcooled liquid
                                                             T cr = 393.95°C;
                                                   (compressed
                   Liquid  Saturation line  T cr =393.95°C  200  liquid)  r cr = 3 22.0 (kg m −3 )
              10                 Superheated vapour        Saturated liquid - vapor
                         Overheated  (superheated steam)  Saturated liquid  (wet vapor)  Dry saturated vapor
                           vapour               100
                          (steam)
              0
                 100  200  300  400  500  600  700  0  1  2  3  4  5  6  7  8  9
                                                                        –1
                          Temperature (°C)               Specific entropy (kJ (kg K) )
            (A)                                (B)
           Fig. 4.36 Thermodynamic diagrams for light water [1]: (A) Pressure-temperature diagram; and
           (B) temperature-specific-entropy diagram.

             16                                 80
                Compressed fluid  Supercritical fluid       Supercritical fluid
                                                   Fluid: CO 2
             14                                 60                      P=P cr
                                                          (liquid-like)
                                                                   (gas-like)
             12       High density  Low density           High density  Pseudocritical line  Low density
                       (liquid-like)  Pseudocritical line  (gas-like)  40  T=T cr  Superheated
             Pressure (MPa)  8  P cr = 7.3773 MPa  Critical point  Temperature (°C)  20  Compressed fluid  P cr = 7.37 MPa;  Overheated
             10
                                                                         vapor
                                                                        vapor
                                                  Subcooled liquid
                                                              T cr = 30.98°C;
                                                  (compressed
                                                  liquid)
              6
                  Liquid       Superheated vapour  0       Saturated liquid - vapor
                  Saturation line              –20            r cr = 467.6 (kg m –3 ) Dry saturated vapor
              4                                               (wet vapor)
              2       Overheated  T cr = 30.978°C       Saturated liquid
                       vapour
              0                                –40
                –40 –20  0  20  40  60  80  100 120  0.4  0.6  0.8 1.0  1.2 1.4 1.6 1.8  2.0  2.2
                                                                       –1
                         Temperature (°C)              Specific entropy (kJ (kg K) )
            (A)                              (B)
           Fig. 4.37 Thermodynamic diagrams for carbon dioxide [1]: (A) Pressure-temperature diagram;
           and (B) temperature-specific-entropy diagram.
   200   201   202   203   204   205   206   207   208   209   210