
Page 288 - Managing Global Warming
P. 288
248 Managing Global Warming
(o) Membrane
Because the specimens in the tests were subjected to low temperatures and high pres-
sures, latex membranes conventionally used in triaxial tests were avoided; instead,
silicon-type membranes were used because of their flexibility under low temperature
and high pressure conditions. Note that because methane gas can permeate through
silicon to some degree, butyl rubber was used in long-term tests, such as during
MH dissociation.
The measuring apparatus was connected to a data collection system, with the ver-
tical load, axial displacement, confining pressure, volume change of specimen, and
pore water pressure automatically recorded by computer. To verify the accuracy of
the measuring devices, the following shear tests were done using samples of silica
sand which did not contain MH.
7.3.2 Specimen preparation
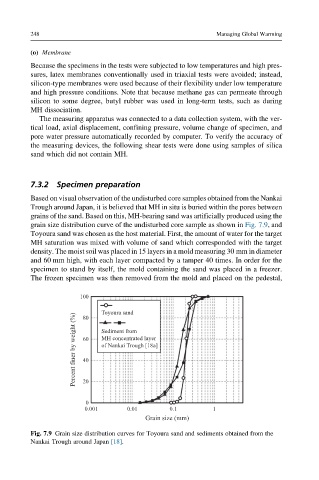
Based on visual observation of the undisturbed core samples obtained from the Nankai
Trough around Japan, it is believed that MH in situ is buried within the pores between
grains of the sand. Based on this, MH-bearing sand was artificially produced using the
grain size distribution curve of the undisturbed core sample as shown in Fig. 7.9, and
Toyoura sand was chosen as the host material. First, the amount of water for the target
MH saturation was mixed with volume of sand which corresponded with the target
density. The moist soil was placed in 15 layers in a mold measuring 30 mm in diameter
and 60 mm high, with each layer compacted by a tamper 40 times. In order for the
specimen to stand by itself, the mold containing the sand was placed in a freezer.
The frozen specimen was then removed from the mold and placed on the pedestal,
100 Toyoura sand
Percent finer by weight (%) 60 Sediment from
80
MH concentrated layer
of Nankai Trough [18a]
40
20
0
0.001 0.01 0.1 1
Grain size (mm)
Fig. 7.9 Grain size distribution curves for Toyoura sand and sediments obtained from the
Nankai Trough around Japan [18].