
Page 292 - Managing Global Warming
P. 292
252 Managing Global Warming
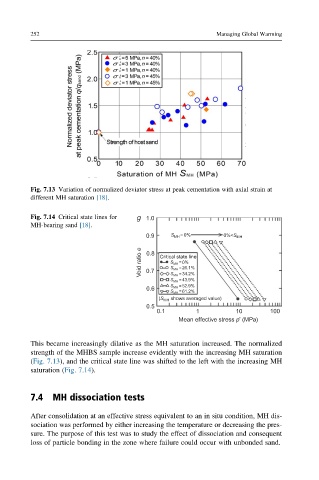
Fig. 7.13 Variation of normalized deviator stress at peak cementation with axial strain at
different MH saturation [18].
Fig. 7.14 Critical state lines for g 1.0
MH-bearing sand [18].
0.9 S MH =0% 0%<S MH
Void ratio e 0.8 Critical state line
S MH =0%
S MH =26.1%
0.7
S MH =34.2%
S MH =43.9%
S MH =52.9%
0.6
S MH =61.2%
(S MH shows averaged value)
0.5
0.1 1 10 100
Mean effective stress p' (MPa)
This became increasingly dilative as the MH saturation increased. The normalized
strength of the MHBS sample increase evidently with the increasing MH saturation
(Fig. 7.13), and the critical state line was shifted to the left with the increasing MH
saturation (Fig. 7.14).
7.4 MH dissociation tests
After consolidation at an effective stress equivalent to an in situ condition, MH dis-
sociation was performed by either increasing the temperature or decreasing the pres-
sure. The purpose of this test was to study the effect of dissociation and consequent
loss of particle bonding in the zone where failure could occur with unbonded sand.