
Page 290 - Managing Global Warming
P. 290
250 Managing Global Warming
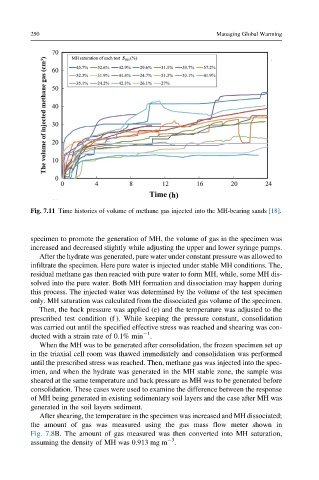
Fig. 7.11 Time histories of volume of methane gas injected into the MH-bearing sands [18].
specimen to promote the generation of MH, the volume of gas in the specimen was
increased and decreased slightly while adjusting the upper and lower syringe pumps.
After the hydrate was generated, pure water under constant pressure was allowed to
infiltrate the specimen. Here pure water is injected under stable MH conditions. The,
residual methane gas then reacted with pure water to form MH, while, some MH dis-
solved into the pure water. Both MH formation and dissociation may happen during
this process. The injected water was determined by the volume of the test specimen
only. MH saturation was calculated from the dissociated gas volume of the specimen.
Then, the back pressure was applied (e) and the temperature was adjusted to the
prescribed test condition (f ). While keeping the pressure constant, consolidation
was carried out until the specified effective stress was reached and shearing was con-
1
ducted with a strain rate of 0.1% min .
When the MH was to be generated after consolidation, the frozen specimen set up
in the triaxial cell room was thawed immediately and consolidation was performed
until the prescribed stress was reached. Then, methane gas was injected into the spec-
imen, and when the hydrate was generated in the MH stable zone, the sample was
sheared at the same temperature and back pressure as MH was to be generated before
consolidation. These cases were used to examine the difference between the response
of MH being generated in existing sedimentary soil layers and the case after MH was
generated in the soil layers sediment.
After shearing, the temperature in the specimen was increased and MH dissociated;
the amount of gas was measured using the gas mass flow meter shown in
Fig. 7.8B. The amount of gas measured was then converted into MH saturation,
3
assuming the density of MH was 0.913 mg m .