
Page 63 - Managing Global Warming
P. 63
40 Managing Global Warming
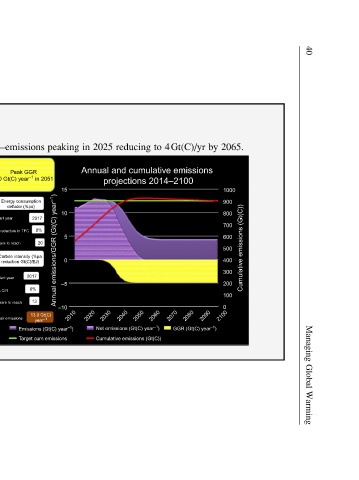
2065. 1000 900 800 700 600 500 400 300 200 Cumulative emissions (Gt(C)) 100 0
by 2100 2090
4Gt(C)/yr 2080 2070 GGR (Gt(C) year –1 )
to Annual and cumulative emissions projections 2014–2100 2060
reducing 2050 2040 Net emissions (Gt(C) year –1 ) Cumulative emissions (Gt(C))
2025 2030
in 2020
peaking 15 –1 10 5 0 –5 Annual emissions/GGR (Gt(C) year ) –10 13.0 Gt(C) 2010 year –1 Emissions (Gt(C) year –1 ) Target cum emissions
2051—emissions Peak GGR 5.0 Gt(C) year –1 in 2051
in 2100
peaking 2090 TFC/year (EJ)
2025 2080 2070
from Annual energy projections 2014–2100 2060 ZEE/year (EJ)
GGR 2050 2040
5Gt(C)/yr 2030 FF/year (EJ)
+ 2020
ZEE 1800 1600 1400 1200 1000 800 600 400 200 0 2010
—cont’d 1.8°C: Total final consumption (EJ) ZEE index 13
2.2 17: +1.8°C Years to peak
Box Scenario