Page 135 - Manufacturing Engineering and Technology - Kalpakjian, Serope : Schmid, Steven R.
P. 135

Chapter 4  Metal Alloys: Their Structure and Strengthening by Heat Treatment

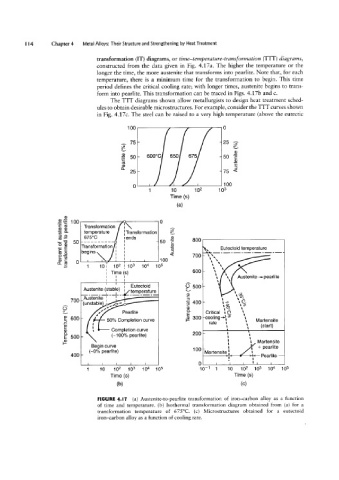
                                   transformation (IT) diagrams, or time-temperature-transformation (TTT) diagrams,
                                   constructed from the data given in Fig. 4.17a. The higher the temperature or the
                                   longer the time, the more austenite that transforms into pearlite. Note that, for each
                                   temperature, there is a minimum time for the transformation to begin. This time
                                   period defines the critical cooling rate; with longer times, austenite begins to trans-
                                   form into pearlite. This transformation can be traced in Figs. 4.17b and c.
                                        The TTT diagrams shown allow metallurgists to design heat treatment sched-
                                   ules to obtain desirable microstructures. For example, consider the TTT curves shown
                                   in Fig. 4.17c. The steel can be raised to a very high temperature (above the eutectic


                                              100                              0

                                           § 75                                25 g
                                           I                                       as
                                           5   50   600°C    650   675         50  #5
                                            E                                      2
                                            Q)                                     U)
                                                                                   3
                                           D_
                                               25                              75 <
                                                0            J                 100
                                                     1       10      102      103
                                                             Time (s)
                                                               (3)

                      Q, £2   Transformation
                     7; E 100                            0
                      g Q                                    A
                     ‘5 Q     temperature    :Transformation  52
                      Q, 2     675°C         lends           2      800

                     ~5 3  50 ------ f--q                50  E
                                                                              Eutectoid temperature
                                                                        `\`
                                   \=~
                     *E §     ;;ag'E;°rmat'°n                ‘Q     700'f"\\"""
                     dl! %  O                            100  <           \\ \\
                       45      1    101  102  103  104  105                ‘\ \\
                                        Time (S)                    500 '   ‘\  \
                                                                             \  \\  Austenite -»pearlite
                                                                  9          \
                                               Eutectoid          O 500-     ‘
                             l“?T'f‘ii‘?HE)_;43@Qe2Qf@            3;               \  O,
                          700 _Austenite               Q          ‘5           \    \01>
                       A      (unstable)  ,¢,--                   ‘Q 400'      M;   ‘\%
                       o              "                           <11           Q,
                       V           I/'      Pearlite              2-     Critical  ) Q  \\\
                       O
                                                                        _        (D
                       Q 600           50% Completion curve       2 300  CQZLZQT)      \   Martensite
                       (U        l                                              \      ‘\   (start)
                       :_
                       co         1     Completion curve                [_      1       \
                       Q 500            (~100%pear|ite)             200          1      \`
                       |9                                                        1       \  Martensite
                                 5691" CUVY9                         100 _ -li   1       \  + pearlite
                          400 '  (~0% Peaflltel                          Martensite  :   I  I  Pearlite-
                                                                       O         -1      l
                                1   10   102  103  104  105            10_1  1   10  102  103  104  105
                                        Time (s)                                   Time (s)
                                          (D)                                        (C)

                                   FIGURE 4.l1  (a) Austenite-to-pearlite transformation of iron-carbon alloy as a function
                                   of time and temperature. (b) Isothermal transformation diagram obtained from (a) for a
                                   transformation temperature of 675°C.  (c) Microstructures obtained for  a eutectoid
                                   iron-car on a loy as a function of cooling rate.
                                          b
                                              l
   130   131   132   133   134   135   136   137   138   139   140