
Page 125 - 04. Subyek Engineering Materials - Manufacturing, Engineering and Technology SI 6th Edition - Serope Kalpakjian, Stephen Schmid (2009)
P. 125
Chapter 4 Metal Alloys: Their Structure and Strengthening by Heat Treatment
Coming °f"°1U'd Shrinkage of solid
Freezing begins
Freezing
ends
CD
s. Y""
3 A B ga
'O
Freezing _Q Solidification
temperature 25) shrinkage
Cooling of 3
solid
Liquid
T L'qu'd S;_d Sohd > Shrinkage of liquid
Time Time
(H) (D)
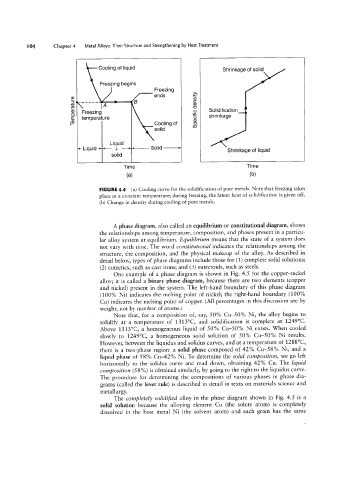
FIGURE 4.4 (a) Cooling curve for the solidification of pure metals. Note that freezing takes
place at a constant temperature; during freezing, the latent heat of solidification is given off.
(b) Change in density during cooling of pure metals.
A phase diagram, also called an equilibrium or constitutional diagram, shows
the relationships among temperature, composition, and phases present in a particu-
lar alloy system at equilibrium. Equilibrium means that the state of a system does
not vary with time. The word constitutional indicates the relationships among the
structure, the composition, and the physical makeup of the alloy. As described in
detail below, types of phase diagrams include those for (1) complete solid solutions;
(2) eutectics, such as cast irons; and (3) eutectoids, such as steels.
One example of a phase diagram is shown in Fig. 4.5 for the copper-nickel
alloy; it is called a binary phase diagram, because there are two elements (copper
and nickel) present in the system. The left-hand boundary of this phase diagram
(100% Ni) indicates the melting point of nickel; the right-hand boundary (100%
Cu) indicates the melting point of copper. (All percentages in this discussion are by
weight, not by number of atoms.)
Note that, for a composition of, say, 50% Cu-50% Ni, the alloy begins to
solidify at a temperature of 1313°C, and solidification is complete at 1249°C.
Above 1313°C, a homogeneous liquid of 50% Cu-50% Ni exists. When cooled
slowly to 1249°C, a homogeneous solid solution of 50% Cu-50% Ni results.
However, between the liquidus and solidus curves, and at a temperature of 1288°C,
there is a two-phase region: a solid phase composed of 42% Cu-58% Ni, and a
liquid phase of 58% Cu-42% Ni. To determine the solid composition, we go left
horizontally to the solidus curve and read down, obtaining 42% Cu. The liquid
composition (58%) is obtained similarly, by going to the right to the liquidus curve.
The procedure for determining the compositions of various phases in phase dia-
grams (called the lever rule) is described in detail in texts on materials science and
metallurgy.
The completely solidi/Qecl alloy in the phase diagram shown in Fig. 4.5 is a
solid solution because the alloying element Cu (the solute atom) is completely
dissolved in the host metal Ni (the solvent atom) and each grain has the same
Tem
perat