
Page 95 - 04. Subyek Engineering Materials - Manufacturing, Engineering and Technology SI 6th Edition - Serope Kalpakjian, Stephen Schmid (2009)
P. 95
Chapter 2 Mechanical Behavior, Testing, and Manufacturing Properties of Materials
2.7 Fatigue
Various components in manufacturing equipment, such as tools, dies, gears, cams,
shafts, and springs, are subjected to rapidly fluctuating (cyclic or periodic) loads, in
addition to static loads. Cyclic stresses may be caused by fluctuating mechanical
loads, such as (a) on gear teeth or reciprocating sliders, (b) by rotating machine
elements under constant bending stresses, as is commonly encountered by shafts, or
(c) by thermal stresses, as when a die comes into repeated contact with hot work-
pieces and cools between successive contacts. Under these conditions, the part fails
at a stress level below that at which failure would occur under static loading. Upon
inspection, failure is found to be associated with cracks that grow with every stress
cycle and that propagate through the material until a critical crack length is reached,
when the material fractures. Known as fatigue failure, this phenomenon is responsi-
ble for the majority of failures in mechanical components.
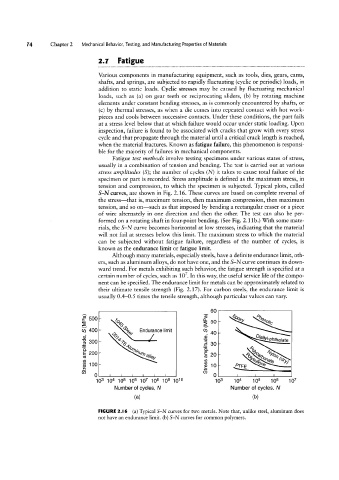
Fatigue test methods involve testing specimens under various states of stress,
usually in a combination of tension and bending. The test is carried out at various
stress amplitudes (S), the number of cycles (N) it takes to cause total failure of the
specimen or part is recorded. Stress amplitude is defined as the maximum stress, in
tension and compression, to which the specimen is subjected. Typical plots, called
S-N curves, are shown in Fig. 2.16. These curves are based on complete reversal of
the stress-that is, maximum tension, then maximum compression, then maximum
tension, and so on-such as that imposed by bending a rectangular eraser or a piece
of wire alternately in one direction and then the other. The test can also be per-
formed on a rotating shaft in four-point bending. (See Fig. 2.11b.) With some mate-
rials, the S-N curve becomes horizontal at low stresses, indicating that the material
will not fail at stresses below this limit. The maximum stress to which the material
can be subjected without fatigue failure, regardless of the number of cycles, is
known as the endurance limit or fatigue limit.
Although many materials, especially steels, have a definite endurance limit, oth-
ers, such as aluminum alloys, do not have one, and the S-N curve continues its down-
ward trend. For metals exhibiting such behavior, the fatigue strength is specified at a
certain number of cycles, such as 107. In this way, the useful service life of the compo-
nent can be specified. The endurance limit for metals can be approximately related to
their ultimate tensile strength (Fig. 2.17). For carbon steels, the endurance limit is
usually 0.4-0.5 times the tensile strength, although particular values can vary.
107665 gr 5 /°/7 S/7000
60
1?
400 /' Ga/ Endurance limit C0
g 40
%,7 ofa,,,,,_pmh t
300 `%4 2 so aae
4/,,,. 5 Ag/
200 /Dum a//Oy g 20 '%, 1/06/go /VJ’/0/,
3 0% "eve 'Wu
100 g_> 10 /=rFE /ve
O C0 O
103 104 105 106 107 108 109 101° 103 104 105 106 107
Number of cycles, N Number of cycles, N
la) (D)
FIGURE 2.16 (a) Typical S-N curves for two metals. Note that, unlike steel, aluminum does
not have an endurance limit. (b) S-N curves for common polymers.