
Page 295 - Marine Structural Design
P. 295
Chapter I3 Collapse Analysis of Ship Hulls 27 1
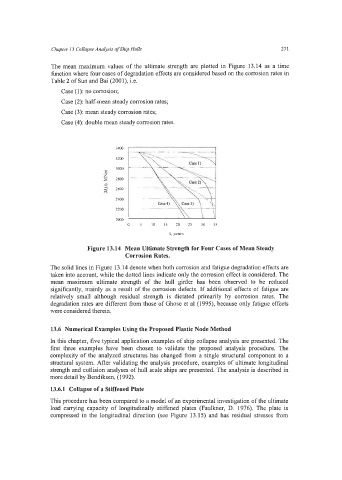
The mean maximum values of the ultimate strength are plotted in Figure 13.14 as a time
function where four cases of degradation effects are considered based on the corrosion rates in
Table 2 of Sun and Bai (2001), i.e.
Case (1): no corrosion;
Case (2): half-mean steady corrosion rates;
Case (3): mean steady corrosion rates;
Case (4): double mean steady corrosion rates.
I
3200
3000
E
5 2800
2600
2400
2200
2000
0 5 10 I5 20 25 30 35
f year.s
Figure 13.14 Mean Ultimate Strength for Four Cases of Mean Steady
Corrosion Rates.
The solid lines in Figure 13.14 denote when both corrosion and fatigue degradation effects are
taken into account, while the dotted lines indicate only the corrosion effect is considered. The
mean maximum ultimate strength of the hull girder has been observed to be reduced
significantly, mainly as a result of the corrosion defects. If additional effects of fatigue are
relatively small although residual strength is dictated primarily by corrosion rates. The
degradation rates are different from those of Ghose et a1 (1995), because only fatigue effects
were considered therein.
13.6 Numerical Examples Using the Proposed Plastic Node Method
In this chapter, five typical application examples of ship collapse analysis are presented. The
first three examples have been chosen to validate the proposed analysis procedure. The
complexity of the analyzed structures has changed from a single structural component to a
structural system. After validating the analysis procedure, examples of ultimate longitudinal
strength and collision analyses of hull scale ships are presented. The analysis is described in
more detail by Bendiksen, (1992).
13.6.1 Collapse of a Stiffened Plate
This procedure has been compared to a model of an experimental investigation of the ultimate
load carrying capacity of longitudinally stiffened plates (Faulkner, D. 1976). The plate is
compressed in the longitudinal direction (see Figure 13.15) and has residual stresses from