
Page 294 - Marine Structural Design
P. 294
270 Part II Ultimate Strength
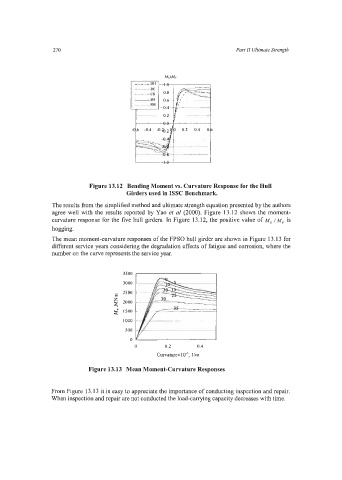
Figure 13.12 Bending Moment vs. Curvature Response for the Hull
Girders used in ISSC Benchmark.
The results from the simplified method and ultimate strength equation presented by the authors
agree well with the results reported by Yao et a1 (2000). Figure 13.12 shows the moment-
curvature response for the five hull girders. In Figure 13.12, the positive value of M, /M~ is
hogging.
The mean moment-curvature responses of the FPSO hull girder are shown in Figure 13.13 for
different service years considering the degradation effects of fatigue and corrosion, where the
number on the curve represents the service year.
3500
3000
E 2500
5- 2000
1500
1000
500
I
0 0.2 0.4
Curvaturex IO”, l/m
Figure 13.13 Mean Moment-Curvature Responses
From Figure 13.13 it is easy to appreciate the importance of conducting inspection and repair.
When inspection and repair are not conducted the load-canying capacity decreases with time.