
Page 292 - Marine Structural Design
P. 292
268 Part II Ultimate Strength
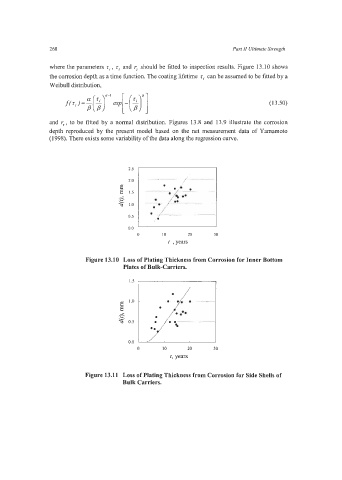
where the parameters zi , z, and r, should be fitted to inspection results. Figure 13.10 shows
the corrosion depth as a time function. The coating lifetime zi can be assumed to be fitted by a
Weibull distribution,
(13.50)
and r3, to be fitted by a normal distribution. Figures 13.8 and 13.9 illustrate the corrosion
depth reproduced by the present model based on the net measurement data of Yamamoto
(1998). There exists some variability of the data along the regression curve.
2.0 I -- /-
/
/ J
1
0.0
0 IO 20 30
t ,years
Figure 13.10 Loss of Plating Thickness from Corrosion for Inner Bottom
Plates of Bulk-Carriers.
1.5
0.0
0 IO 20 30
t, years
Figure 13.11 Loss of Plating Thickness from Corrosion for Side Shells of
Bulk Carriers.