
Page 343 - Marine Structural Design
P. 343
Chapterld Mechanism of Fatigue and Fracture 319
t
unnotched steel
/
sharp shoulder steel/
Number of cycles to failure
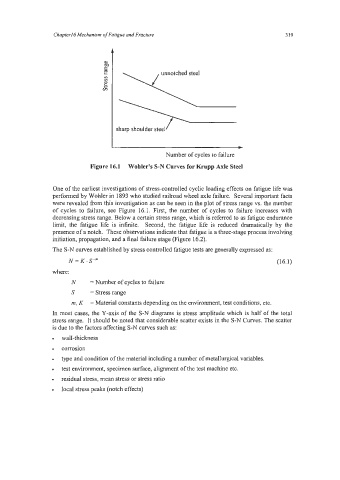
Figure 16.1 Wohler's S-N Curves for Krupp Axle Steel
One of the earliest investigations of stress-controlled cyclic loading effects on fatigue life was
performed by Wohler in 1893 who studied railroad wheel axle failure. Several important facts
were revealed from this investigation as can be seen in the plot of stress range vs. the number
of cycles to failure, see Figure 16.1. First, the number of cycles to failure increases with
decreasing stress range. Below a certain stress range, which is referred to as fatigue endurance
limit, the fatigue life is infinite. Second, the fatigue life is reduced dramatically by the
presence of a notch. These observations indicate that fatigue is a three-stage process involving
initiation, propagation, and a final failure stage (Figure 16.2).
The S-N curves established by stress controlled fatigue tests are generally expressed as:
N = K. S-" (16.1)
where:
N = Number of cycles to failure
S =Stressrange
rn, K = Material constants depending on the environment, test conditions, etc.
In most cases, the Y-axis of the S-N diagrams is stress amplitude which is half of the total
stress range. It should be noted that considerable scatter exists in the S-N Curves. The scatter
is due to the factors affecting S-N curves such as:
type and condition of the material including a number of metallurgical variables.
test environment, specimen surface, alignment of the test machine etc.
residual stress, mean stress or stress ratio
local stress peaks (notch effects)