
Page 347 - Marine Structural Design
P. 347
Chapter16 Mechanism of Fatigue and Fracture 323
\ ,Total strain
T--+-ii'
!I
.- e Elastichigh cycle fati@
V idlasticnow cycle fatigue
4
I w
1 2Nf
Reversals to failure (in log scale)
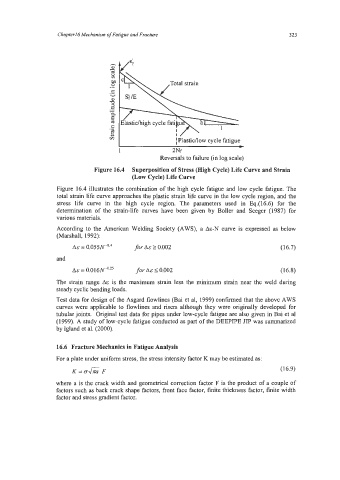
Figure 16.4 Superposition of Stress (High Cycle) Life Curve and Strain
(Low Cycle) Life Curve
Figure 16.4 illustrates the combination of the high cycle fatigue and low cycle fatigue. The
total strain life curve approaches the plastic strain life curve in the low cycle region, and the
stress life curve in the high cycle region. The parameters used in Eq.(16.6) for the
determination of the strain-life curves have been given by Boller and Seeger (1987) for
various materials.
According to the American Welding Society (AWS), a As-N curve is expressed as below
(Marshall, 1992):
AS = 0.055N4.4 for AE 2 0.002 (16.7)
and
AE = 0.016N4.25 for AE I 0.002 (16.8)
The strain range As is the maximum strain less the minimum strain near the weld during
steady cyclic bending loads.
Test data for design of the Asgard flowlines (Bai et al, 1999) confirmed that the above AWS
curves were applicable to flowlines and risers although they were originally developed for
tubular joints. Original test data for pipes under low-cycle fatigue are also given in Bai et a1
(1999). A study of low-cycle fatigue conducted as part of the DEEPIPE JIP was summarized
by Igland et al. (2000).
16.6 Fracture Mechanics in Fatigue Analysis
For a plate under uniform stress, the stress intensity factor K may be estimated as:
K=U&F (16.9)
where a is the crack width and geometrical correction factor F is the product of a couple of
factors such as back crack shape factors, front face factor, finite thickness factor, finite width
factor and stress gradient factor.