
Page 348 - Marine Structural Design
P. 348
324 Part III Fatigue and Fracture
For fatigue crack growth, the zone of inelasticity is often small enough for the small scale
yielding assumption to be valid. Linear fracture mechanics can thus be applied in the fatigue
crack growth analysis.
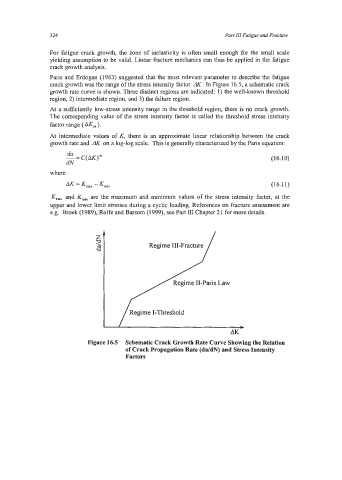
Paris and Erdogan (1963) suggested that the most relevant parameter to describe the fatigue
crack growth was the range of the stress intensity factor AK . In Figure 16.5, a schematic crack
growth rate curve is shown. Three distinct regions are indicated: 1) the well-known threshold
region, 2) intermediate region, and 3) the failure region.
At a sufficiently low-stress intensity range in the threshold region, there is no crack growth.
The corresponding value of the stress intensity factor is called the threshold stress intensity
factor range ( AK,,, ).
At intermediate values of K, there is an approximate linear relationship between the crack
growth rate and dK on a log-log scale. This is generally characterized by the Paris equation:
da
- C(AK)" (16.10)
=
dN
where
AK = K,, - K,, (16.11)
K,, and K, are the maximum and minimum values of the stress intensity factor, at the
upper and lower limit stresses during a cyclic loading. References on fracture assessment are
e.g. Broek (1989), Rolfe and Barsom (1999), see Part III Chapter 21 for more details.
Regime Ill-Fracture
Regime 11-Paris Law
Regime
I-Threshold
Regime I-Threshold
b
b
AK
AK
Figure 16.5 Schematic Crack Growth Rate Curve Showing the Relation
of Crack Propagation Rate (daldN) and Stress Intensity
Factors