
Page 345 - Marine Structural Design
P. 345
Chapter1 6 Mechanism of Fatigue and Fracture 321
In the literature, several modifications to the Palmgren-Miners law have been suggested
related to the damage ratio, endurance limits, etc. The Palmgren-Miner law has still been
widely applied in engineering due to its simplicity.
16.5 Strain-Controlled Fatigue
The fatigue of a specimen subjected to strain controlled loading is generally related to low
cycle high stress fatigue. The stress associated with low cycle fatigue will usually be high
enough to cause a considerable amount of plastic deformation in the region of the stress
concentration. Thus, the relation between stress and strain will no longer be linear. This
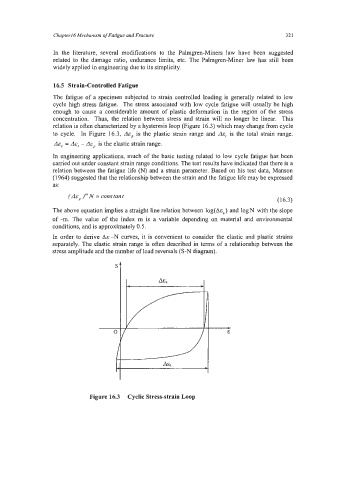
relation is often characterized by a hysteresis loop (Figure 16.3) which may change from cycle
to cycle. In Figure 16.3, AE, is the plastic strain range and LIE, is the total strain range.
do, = As, -A&, is the elastic strain range.
In engineering applications, much of the basic testing related to low cycle fatigue has been
carried out under constant strain range conditions. The test results have indicated that there is a
relation between the fatigue life (N) and a strain parameter. Based on his test data, Manson
(1964) suggested that the relationship between the strain and the fatigue life may be expressed
as:
(do,)" N = constant
(1 6.3)
The above equation implies a straight line relation between log(Ae,) and logN with the slope
of -m. The value of the index m is a variable depending on material and environmental
conditions, and is approximately 0.5.
In order to derive AE-N curves, it is convenient to consider the elastic and plastic strains
separately. The elastic strain range is often described in terms of a relationship between the
stress amplitude and the number of load reversals (S-N diagram).
Figure 16.3 Cyclic Stress-strain Loop