
Page 417 - Marine Structural Design
P. 417
Chapter 21 Application of Fracture Mechanics 393
(21.4)
where a is the length of a through-crack in an infinite plate equivalent in severity to that of the
crack in the element under investigation, and E is Young's Modulus.
21.2.2 The British Welding Institute (CTOD Design Curve)
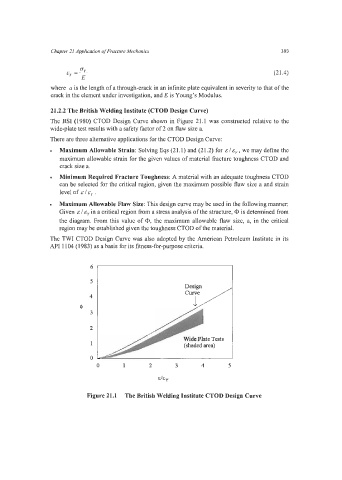
The BSI (1980) CTOD Design Curve shown in Figure 21.1 was constructed relative to the
wide-plate test results with a safety factor of 2 on flaw size a.
There are three alternative applications for the CTOD Design Curve:
Maximum Allowable Strain: Solving Eqs (21.1) and (21.2) for E I cy, we may define the
maximum allowable strain for the given values of material fracture toughness CTOD and
crack size a.
Minimum Required Fracture Toughness: A material with an adequate toughness CTOD
can be selected for the critical region, given the maximum possible flaw size a and strain
level of E I E' .
Maximum Allowable Flaw Size: This design curve may be used in the following manner:
Given E I cy in a critical region from a stress analysis of the structure, 0 is determined from
the diagram. From this value of 0, the maximum allowable flaw size, a, in the critical
region may be established given the toughness CTOD of the material.
The TWI CTOD Design Curve was also adopted by the American Petroleum Institute in its
API 1104 (1983) as a basis for its fitness-for-purpose criteria.
5
4
4
3
2
Wide Plate Tests
1 (shaded area)
0
0 1 2 3 4 5
€laY
Figure 21.1 The British Welding Institute CTOD Design Curve