
Page 418 - Marine Structural Design
P. 418
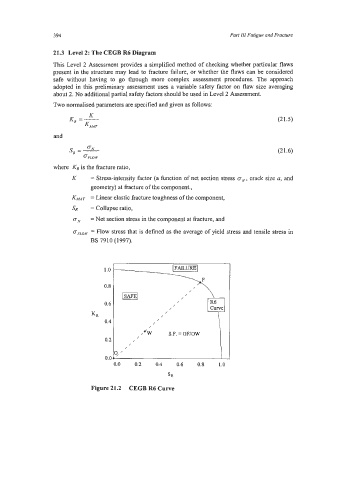
394                                                   Part 111 Fatigue and Fracture

                 21.3  Level 2: The CEGB R6 Diagram

                 This Level 2 Assessment provides a simplified method of checking whether particular flaws
                 present in the structure may lead to fracture failure, or whether the flaws can be considered
                 safe  without  having  to  go  through  more  complex  assessment procedures.  The  approach
                 adopted in this preliminary assessment uses a variable safety factor on  flaw size averaging
                 about 2. No additional partial safety factors should be used in Level 2 Assessment.
                 Two normalised parameters are specified and given as follows:
                            K
                      K, =-                                                          (21.5)
                          KM”,
                 and

                      s,  =-   ON                                                    (21.6)
                          ~FLOW
                 where  KR is the fracture ratio,
                       K    = Stress-intensity factor (a function of net section stress cN, crack size a, and
                            geometry) at fracture of the component.,
                       KMAT = Linear elastic fracture toughness of the component,
                       SR   = Collapse ratio,
                       cN   = Net section stress in the component at fracture, and
                       crFLow = Flow stress that is defined as the average of yield stress and tensile stress in
                            BS 7910 (1997).


                                 1.0


                                 0.8
                                 0.2 1           /
                                 0.6 I               /  /       I R6
                             KR                   /  /  /
                                 0.4           /    S.F. = OF/OW    1


                                    o,/  //W
                                 0.0
                                   0.0    0.2   0.4    0.6   0.8   1.0
                                                    SR

                             Figure 21.2  CEGB R6 Curve