Page 416 - Marine Structural Design
P. 416
392                                                   Part III Fatigue and Fracture

                 Maximum Tolerable Defect Size
                 A maximum tolerable defect size can be derived when the geometry and the fracture toughness
                 of the selected material are known. For statically loaded structures, the maximum tolerable
                 defect size must satisfy the fracture mechanics criteria. For dynamically loaded structures, the
                 maximum tolerable defect size represents the critical crack size in a fatigue failure event. It
                 may be used to minimise the risk  of unstable fracture throughout the operating life of the
                 structure. The result also gives direct input to the calculation of fatigue crack growth period.
                 There are three levels of procedure that are applied in fracture assessment (Reemsnyder, 1997):
                 Level 1.  Utilisation  of  the  Crack-Tip  Opening  Displacement  (CTOD)  Design  Curve
                          (explained in Section 2 1.2)
                 Level 2.   The Normal Assessment or Design Safety Format that makes use of the Failure
                          Assessment Diagram (described in Section 21.3). No practical safety factors need
                    to    be applied here.
                 Level 3.   Utilisation of the Failure Assessment Diagram based on detailed information of
                          stress-strain curves of materials. Partial safety factors are applied to the defect size,
                          stress level, etc., see Section 21.4.
                 More information may be found from MI 579 (2001), Andersen (1991) and BSI (1999).


                 21.2  Level 1: The CTOD Design Curve
                 21.2.1  The Empirical Equations

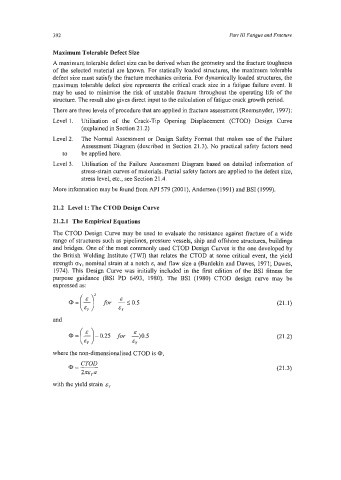
                 The CTOD Design Curve may be used  to evaluate the resistance against fracture of a wide
                 range of structures such as pipelines, pressure vessels, ship and offshore structures, buildings
                 and bridges. One of the most commonly used CTOD Design Curves is the one developed by
                 the British Welding Institute (TWI)  that relates the CTOD at some critical event, the yield
                 strength cy, nominal strain at a notch E,  and flaw size a (Burdekin and Dawes, 1971; Dawes,
                 1974). This Design Curve was  initially included in the  first edition of the BSI fitness for
                 purpose  guidance  (BSI  PD  6493,  1980).  The  BSI  (1980)  CTOD  design  curve  may  be
                 expressed as:
                                     E
                                for  -50.5                                           (21.1)
                      a=(:)’         EY
                 and

                                                                                     (21.2)
                                         EY
                 where the non-dimensionalised CTOD is @,

                                                                                     (21.3)

                 with the yield strain sy

