
Page 411 - Marine Structural Design
P. 411
Chapter 20 Spectral Fatigue Analysis and Design 387
y,Lx
0
:F
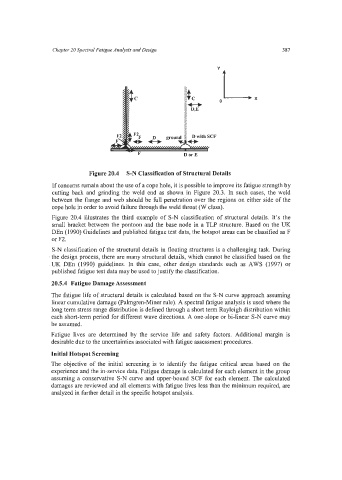
Figure 20.4 S-N Classification of Structural Details
If concerns remain about the use of a cope hole, it is possible to improve its fatigue strength by
cutting back and grinding the weld end as shown in Figure 20.3. In such cases, the weld
between the flange and web should be full penetration over the regions on either side of the
cope hole in order to avoid failure through the weld throat (W class).
Figure 20.4 illustrates the third example of S-N classification of structural details. It’s the
small bracket between the pontoon and the base node in a TLP structure. Based on the UK
DEn (1990) Guidelines and published fatigue test data, the hotspot areas can be classified as F
or F2.
S-N classification of the structural details in floating structures is a challenging task. During
the design process, there are many structural details, which cannot be classified based on the
UK DEn (1990) guidelines. In this case, other design standards such as AWS (1997) or
published fatigue test data may be used to justify the classification.
20.5.4 Fatigue Damage Assessment
The fatigue life of structural details is calculated based on the S-N curve approach assuming
linear cumulative damage (Palmgren-Miner rule). A spectral fatigue analysis is used where the
long term stress range distribution is defined through a short term Rayleigh distribution within
each short-term period for different wave directions. A one-slope or bi-linear S-N curve may
be assumed.
Fatigue lives are determined by the service life and safety factors. Additional margin is
desirable due to the uncertainties associated with fatigue assessment procedures.
Initial Hotspot Screening
The objective of the initial screening is to identify the fatigue critical areas based on the
experience and the in-service data. Fatigue damage is calculated for each element in the group
assuming a conservative S-N curve and upper-bound SCF for each element. The calculated
damages are reviewed and all elements with fatigue lives less than the minimum required, are
analyzed in further detail in the specific hotspot analysis.