
Page 407 - Marine Structural Design
P. 407
Chapter 20 Spectral Fatigue Analysis and Design 383
accordance with the chosen S-N curves. A discussion of the SCF and S-N classification is
given in later Sections.
The SCF can be determined based on parametric equations and finite element analysis.
S-N Curves
In the United States, the AWS (1997) S-N curves are used to analyze structural details of
floating structures. Where variations of stress are applied to conventional weld details
identified in Figure 9.1 of AWS (1 997), the associated S-N curves in Figures 9.2 or 9.3, should
be used, depending on the degree of criticality. Where such variations of stress are applied to
situations identified in AWS (1997) Table 10.3. The associated S-N curves are provided in
AWS D1.l, Figure 10.6. For referenced S-N curves in AWS (1997), Figures 9.2,9.3 and 10.6,
are Class Curves. For such curves the nominal stress range in the vicinity of the detail should
be used.
In Europe, UK DEn (1 990) S-N curves are used for structural details in floating structures.
The S-N classification is determined based on the structural configurations, applied loading
and welding quality.
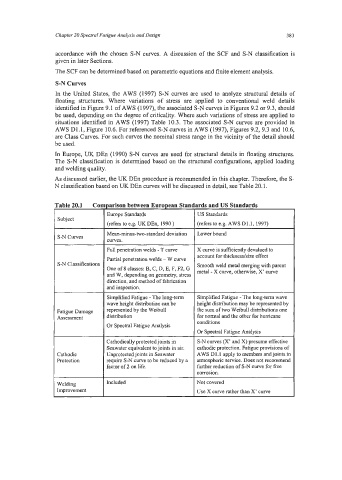
As discussed earlier, the UK DEn procedure is recommended in this chapter. Therefore, the S-
N classification based on UK DEn curves will be discussed in detail, see Table 20.1.
rable 20.1 Co! parison between European Standards and US Standards
Europe Standards US Standards
Subject
(refers to e.g. UK DEn, 1990 ) (refers to e.g. AWS D1.l, 1997)
Mean-minus-two-standard deviation Lower bound
S-N Curves
curves.
Full penetration welds - T curve X curve is sufficiently devalued to
account for thickness/size effect
Partial penetration welds - W curve
S-N Classifications Smooth weld metal merging with parent
One of 8 classes: B, C, D, E, F, F2, G metal - X curve, otherwise, X’ curve
and W, depending on geometry, stress
direction, and method of fabrication
and inmection. l
Simplified Fatigue - The long-term Simplified Fatigue - The long-term wave
wave height distribution can be height distribution may be represented by
Fatigue Damage represented by the Weibull the sum of two Weibull distributions one
Assessment distribution for noma1 and the other for hurricane
Or Spectral Fatigue Analysis conditions
Or Spectral Fatigue Analysis
Cathodically protected joints in S-N curves (X’ and X) presume effective
Seawater equivalent to joints in air. cathodic protection. Fatigue provisions of
Cathodic Unprotected joints in Seawater AWS D1.1 apply to members and joints in
Protection require S-N curve to be reduced by a atmospheric service. Does not recommend
factor of 2 on life. further reduction of S-N curve for free
corrosion.
Welding Included Not covered
Improvement Use X curve rather than X’ curve