
Page 517 - Marine Structural Design
P. 517
Chapter 27 Fatigue Reliability 493
Results and Assessment
Calibration of FM model: S-N curves have been developed based on laboratory tests. On the
other hand, there are larger uncertainties in the material parameters that are used in Fracture
Mechanics (FM) prediction. It is therefore useful to calibrate the FM material parameters
against SN curves. Several analyses were performed with different FM models. Figure 27.3
gives the results of this calibration to achieve a consistent fatigue life based on FM and S-N
approaches respectively. It is seen that if an identical parameter m=3.25 is used for FM and S-
N, the calibrated results are a-EXP(0.02), m-N(3.25,0.06) and p(m,lnC)=-0.95 or Q-
EXP(0.007) and fixed m=3.25. If fixed m=3.5 is used for FM and S-N, the calibrated results
are ao-EXP(0.007), or ao-EXP(O.O15), m-N(3.5,0.06) and p(m,lnC)=O.95. However, different
m values may be applied for different models. If fixed m=3.5 is used for S-N approach, and
m=3.25 is used for FM model, then the calibrated aa follows EXP(0.02). It is seen clearly that
different calibrated are available based on the assumptions made. If crack initiation time
ratio 64.1, this will increase by about 20% compared to the case with 6=0. If more cycles
of N are assumed to be spent in crack initiation, the calibrated a,-, will be expected greater.
Basic parameter studies: Figure 27.3 shows the sensitivity of the reliability at t=4 years, with
no inspection based on FORM analysis.
Effect ofS-Nfatigueparameters: The determination of the fatigue parameters K, m of the S-N
formulation depends strongly on how the considered structural details are classified. It is
assumed that the implied accumulated damage D equals to 0.1 and 0.3 respectively,
corresponding parameters K and m are given in Table 27.8, COV of 1nC and 1nA are set to 0.5
and 0.1 respectively.
Effect of Weibull shape parameter: Based on preliminary investigations of the long-term
distribution, it is assumed that B is 0.95 in this case study. A Parametric study is performed
with the results shown in Figure 27.4. It is seen that the shape parameter B is quite influential
on the fatigue reliability. Generally, the shape parameter B is in the range of 0.8 - 1 .O for ships.
Instead of modeling B as a fixed value, it may be modeled as a stochastic variable. From the
results shown in Figure 27.5, it is seen that if 1/B is modeled as normal distribution with
p=1.0526 and COV=O.l, the p will decrease comparing to the results of fixed B. If it is
assumed that p(l/B, Id)=-0.8, the effect of B is almost as the same as when B is modeled as
fixed.
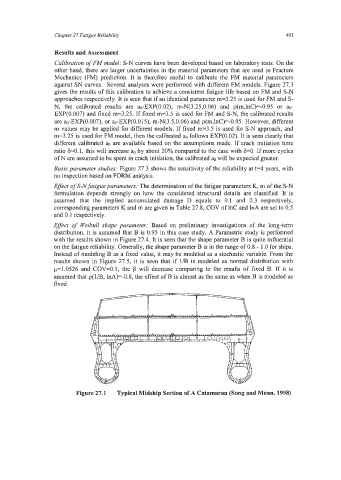
Figure 27.1 Typical Midship Section of A Catamaran (Song and Moan, 1998)