
Page 566 - Marine Structural Design
P. 566
542 Part V Risk Assessment
(30.5)
where,
Pmr = Occurrence probability of dropped object impact
Ni = Annual number of lifts per load category i
= Probability of load dropped from crane for load category i
‘Di
PHg = Probability of equipment j being hit by falling load in category i, given that
the load is dropped
PFv = Probability of failure of equipment j given impact by load in category i
Annual Lift Number and Load Distribution
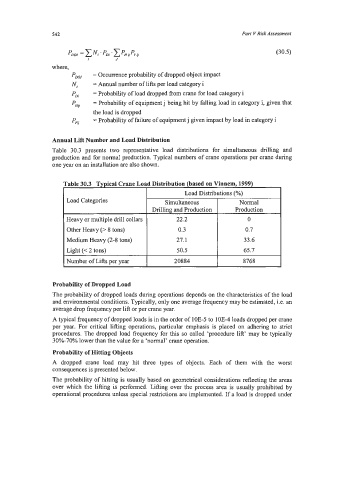
Table 30.3 presents two representative load distributions for simultaneous drilling and
production and for normal production. Typical numbers of crane operations per crane during
one year on an installation are also shown.
Load Distributions (“A)
Load Categories Simultaneous Normal
Drilling and Production Production
Heavy or multiple drill collars 22.2 0
Other Heavy (> 8 tons) 0.3 0.7
Medium Heavy (2-8 tons) 27.1 33.6
Light (c 2 tons) 50.5 65.7
Number of Lifts per year 20884 8768
Probability of Dropped Load
The probability of dropped loads during operations depends on the characteristics of the load
and environmental conditions. Typically, only one average frequency may be estimated, Le. an
average drop fiequency per lift or per crane year.
A typical frequency of dropped loads is in the order of 10E-5 to 10E-4 loads dropped per crane
per year. For critical lifting operations, particular emphasis is placed on adhering to strict
procedures. The dropped load frequency for this so called ‘procedure lift’ may be typically
30%-70% lower than the value for a ‘normal’ crane operation.
Probability of Hitting Objects
A dropped crane load may hit three types of objects. Each of them with the worst
consequences is presented below.
The probability of hitting is usually based on geometrical considerations reflecting the areas
over which the lifting is performed. Lifting over the process area is usually prohibited by
operational procedures unless special restrictions are implemented. If a load is dropped under