
Page 360 - Marketing Management
P. 360
SETTING PRODUCT STRATEGY | CHAPTER 12 337
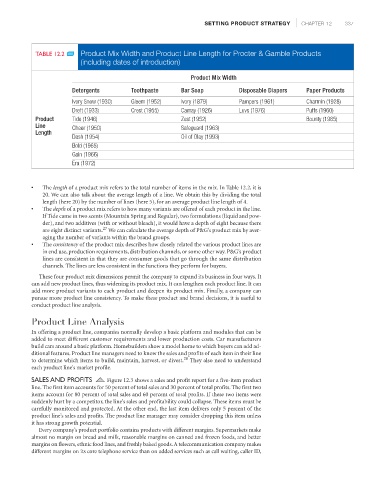
TABLE 12.2 Product Mix Width and Product Line Length for Procter & Gamble Products
(including dates of introduction)
Product Mix Width
Detergents Toothpaste Bar Soap Disposable Diapers Paper Products
Ivory Snow (1930) Gleem (1952) Ivory (1879) Pampers (1961) Charmin (1928)
Dreft (1933) Crest (1955) Camay (1926) Luvs (1976) Puffs (1960)
Product Tide (1946) Zest (1952) Bounty (1965)
Line Cheer (1950) Safeguard (1963)
Length
Dash (1954) Oil of Olay (1993)
Bold (1965)
Gain (1966)
Era (1972)
• The length of a product mix refers to the total number of items in the mix. In Table 12.2, it is
20. We can also talk about the average length of a line. We obtain this by dividing the total
length (here 20) by the number of lines (here 5), for an average product line length of 4.
• The depth of a product mix refers to how many variants are offered of each product in the line.
If Tide came in two scents (Mountain Spring and Regular), two formulations (liquid and pow-
der), and two additives (with or without bleach), it would have a depth of eight because there
27
are eight distinct variants. We can calculate the average depth of P&G’s product mix by aver-
aging the number of variants within the brand groups.
• The consistency of the product mix describes how closely related the various product lines are
in end use, production requirements, distribution channels, or some other way. P&G’s product
lines are consistent in that they are consumer goods that go through the same distribution
channels. The lines are less consistent in the functions they perform for buyers.
These four product mix dimensions permit the company to expand its business in four ways. It
can add new product lines, thus widening its product mix. It can lengthen each product line. It can
add more product variants to each product and deepen its product mix. Finally, a company can
pursue more product line consistency. To make these product and brand decisions, it is useful to
conduct product line analysis.
Product Line Analysis
In offering a product line, companies normally develop a basic platform and modules that can be
added to meet different customer requirements and lower production costs. Car manufacturers
build cars around a basic platform. Homebuilders show a model home to which buyers can add ad-
ditional features. Product line managers need to know the sales and profits of each item in their line
to determine which items to build, maintain, harvest, or divest. 28 They also need to understand
each product line’s market profile.
SALES AND PROFITS Figure 12.3 shows a sales and profit report for a five-item product
line. The first item accounts for 50 percent of total sales and 30 percent of total profits. The first two
items account for 80 percent of total sales and 60 percent of total profits. If these two items were
suddenly hurt by a competitor, the line’s sales and profitability could collapse. These items must be
carefully monitored and protected. At the other end, the last item delivers only 5 percent of the
product line’s sales and profits. The product line manager may consider dropping this item unless
it has strong growth potential.
Every company’s product portfolio contains products with different margins. Supermarkets make
almost no margin on bread and milk, reasonable margins on canned and frozen foods, and better
margins on flowers, ethnic food lines, and freshly baked goods.A telecommunication company makes
different margins on its core telephone service than on added services such as call waiting, caller ID,