
Page 361 - Marketing Management
P. 361
338 PART 5 SHAPING THE MARKET OFFERINGS
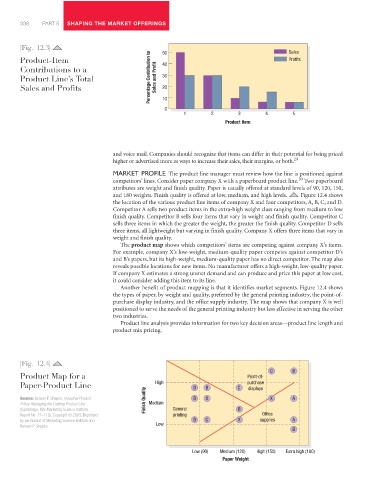
|Fig. 12.3| 50 Sales
Product-Item 40 Profits
Contributions to a
Product Line’s Total Percentage Contribution to Sales and Profit 30
Sales and Profits 20
10
0
1 2 3 4 5
Product Item
and voice mail. Companies should recognize that items can differ in their potential for being priced
higher or advertised more as ways to increase their sales, their margins, or both. 29
MARKET PROFILE The product line manager must review how the line is positioned against
30
competitors’ lines. Consider paper company X with a paperboard product line. Two paperboard
attributes are weight and finish quality. Paper is usually offered at standard levels of 90, 120, 150,
and 180 weights. Finish quality is offered at low, medium, and high levels. Figure 12.4 shows
the location of the various product line items of company X and four competitors, A, B, C, and D.
Competitor A sells two product items in the extra-high weight class ranging from medium to low
finish quality. Competitor B sells four items that vary in weight and finish quality. Competitor C
sells three items in which the greater the weight, the greater the finish quality. Competitor D sells
three items, all lightweight but varying in finish quality. Company X offers three items that vary in
weight and finish quality.
The product map shows which competitors’ items are competing against company X’s items.
For example, company X’s low-weight, medium-quality paper competes against competitor D’s
and B’s papers, but its high-weight, medium-quality paper has no direct competitor. The map also
reveals possible locations for new items. No manufacturer offers a high-weight, low-quality paper.
If company X estimates a strong unmet demand and can produce and price this paper at low cost,
it could consider adding this item to its line.
Another benefit of product mapping is that it identifies market segments. Figure 12.4 shows
the types of paper, by weight and quality, preferred by the general printing industry, the point-of-
purchase display industry, and the office supply industry. The map shows that company X is well
positioned to serve the needs of the general printing industry but less effective in serving the other
two industries.
Product line analysis provides information for two key decision areas—product line length and
product mix pricing.
|Fig. 12.4|
C B
Product Map for a Point-of-
Paper-Product Line High D B C purchase
displays
Finish Quality
Source: Benson P. Shapiro, Industrial Product D X X A
Policy: Managing the Existing Product Line Medium
(Cambridge, MA: Marketing Science Institute General B
Report No. 77–110). Copyright © 2003. Reprinted printing Office
by permission of Marketing Science Institute and D C X supplies A
Low
Benson P. Shapiro.
B
Low (90) Medium (120) High (150) Extra high (180)
Paper Weight