
Page 213 - Master Handbook of Acoustics
P. 213
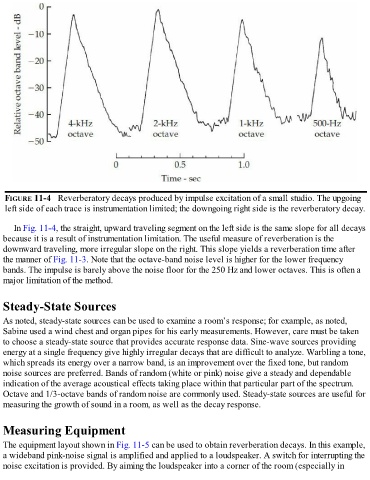
FIGURE 11-4   Reverberatory decays produced by impulse excitation of a small studio. The upgoing
   left side of each trace is instrumentation limited; the downgoing right side is the reverberatory decay.


      In Fig. 11-4, the straight, upward traveling segment on the left side is the same slope for all decays
  because it is a result of instrumentation limitation. The useful measure of reverberation is the

  downward traveling, more irregular slope on the right. This slope yields a reverberation time after
  the manner of Fig. 11-3. Note that the octave-band noise level is higher for the lower frequency
  bands. The impulse is barely above the noise floor for the 250 Hz and lower octaves. This is often a
  major limitation of the method.


  Steady-State Sources


  As noted, steady-state sources can be used to examine a room’s response; for example, as noted,
  Sabine used a wind chest and organ pipes for his early measurements. However, care must be taken
  to choose a steady-state source that provides accurate response data. Sine-wave sources providing
  energy at a single frequency give highly irregular decays that are difficult to analyze. Warbling a tone,
  which spreads its energy over a narrow band, is an improvement over the fixed tone, but random
  noise sources are preferred. Bands of random (white or pink) noise give a steady and dependable
  indication of the average acoustical effects taking place within that particular part of the spectrum.
  Octave and 1/3-octave bands of random noise are commonly used. Steady-state sources are useful for

  measuring the growth of sound in a room, as well as the decay response.


  Measuring Equipment

  The equipment layout shown in Fig. 11-5 can be used to obtain reverberation decays. In this example,
  a wideband pink-noise signal is amplified and applied to a loudspeaker. A switch for interrupting the
  noise excitation is provided. By aiming the loudspeaker into a corner of the room (especially in