
Page 218 - Materials Science and Engineering An Introduction
P. 218
190 • Chapter 6 / Mechanical Properties of Metals
EXAMPLE PROBLEM 6.5
Calculation of Strain-Hardening Exponent
Compute the strain-hardening exponent n in Equation 6.19 for an alloy in which a true stress
of 415 MPa (60,000 psi) produces a true strain of 0.10; assume a value of 1035 MPa (150,000 psi)
for K.
Solution
This requires some algebraic manipulation of Equation 6.19 so that n becomes the dependent
parameter. This is accomplished by taking logarithms and rearranging. Solving for n yields
log s T - log K
n =
log P T
log(415 MPa) - log(1035 MPa)
= = 0.40
log(0.1)
6.8 ELASTIC RECOVERY AFTER
PLASTIC DEFORMATION
Upon release of the load during the course of a stress–strain test, some fraction of the total
deformation is recovered as elastic strain. This behavior is demonstrated in Figure 6.17,
a schematic engineering stress–strain plot. During the unloading cycle, the curve traces
a near straight-line path from the point of unloading (point D), and its slope is virtually
identical to the modulus of elasticity, or parallel to the initial elastic portion of the curve.
The magnitude of this elastic strain, which is regained during unloading, corresponds to
the strain recovery, as shown in Figure 6.17. If the load is reapplied, the curve will traverse
essentially the same linear portion in the direction opposite to unloading; yielding will
again occur at the unloading stress level where the unloading began. There will also be an
elastic strain recovery associated with fracture.
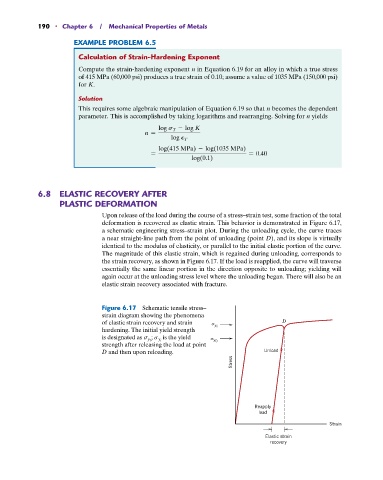
Figure 6.17 Schematic tensile stress–
strain diagram showing the phenomena
of elastic strain recovery and strain D
hardening. The initial yield strength y i
is the yield
is designated as s y 0 ; s y i y 0
strength after releasing the load at point
D and then upon reloading. Unload
Stress
Reapply
load
Strain
Elastic strain
recovery