
Page 215 - Materials Science and Engineering An Introduction
P. 215
6.7 True Stress and Strain • 187
For the static (low strain rate) situation, a measure of toughness in metals
(derived from plastic deformation) may be ascertained from the results of a tensile
Tutorial Video: stress–strain test. It is the area under the s–P curve up to the point of fracture. The
Mechanical units are the same as for resilience (i.e., energy per unit volume of material). For a
Property metal to be tough, it must display both strength and ductility. This is demonstrated
Calculations in Figure 6.13, in which the stress–strain curves are plotted for both metal types.
from Tensile Test Hence, even though the brittle metal has higher yield and tensile strengths, it has a
Measurements lower toughness than the ductile one, as can be seen by comparing the areas ABC
and AB¿C¿ in Figure 6.13.
Concept Check 6.2 Of those metals listed in Table 6.3,
(a) Which will experience the greatest percentage reduction in area? Why?
(b) Which is the strongest? Why?
(c) Which is the stiffest? Why?
[The answer may be found at www.wiley.com/college/callister (Student Companion Site).]
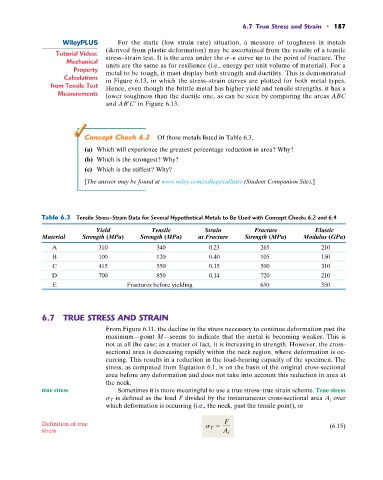
Table 6.3 Tensile Stress–Strain Data for Several Hypothetical Metals to Be Used with Concept Checks 6.2 and 6.4
Yield Tensile Strain Fracture Elastic
Material Strength (MPa) Strength (MPa) at Fracture Strength (MPa) Modulus (GPa)
A 310 340 0.23 265 210
B 100 120 0.40 105 150
C 415 550 0.15 500 310
D 700 850 0.14 720 210
E Fractures before yielding 650 350
6.7 TRUE STRESS AND STRAIN
From Figure 6.11, the decline in the stress necessary to continue deformation past the
maximum—point M—seems to indicate that the metal is becoming weaker. This is
not at all the case; as a matter of fact, it is increasing in strength. However, the cross-
sectional area is decreasing rapidly within the neck region, where deformation is oc-
curring. This results in a reduction in the load-bearing capacity of the specimen. The
stress, as computed from Equation 6.1, is on the basis of the original cross-sectional
area before any deformation and does not take into account this reduction in area at
the neck.
true stress Sometimes it is more meaningful to use a true stress–true strain scheme. True stress
is defined as the load F over
s T divided by the instantaneous cross-sectional area A i
which deformation is occurring (i.e., the neck, past the tensile point), or
Definition of true s T = F (6.15)
stress A i