
Page 210 - Materials Science and Engineering An Introduction
P. 210
182 • Chapter 6 / Mechanical Properties of Metals
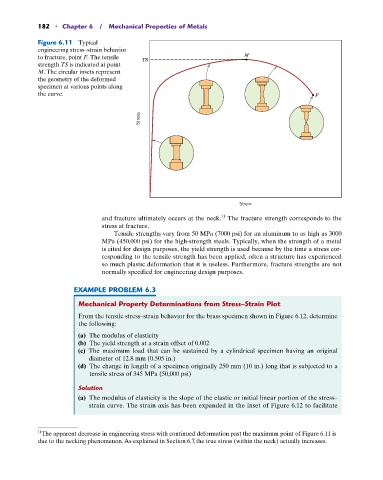
Figure 6.11 Typical
engineering stress–strain behavior
to fracture, point F. The tensile TS M
strength TS is indicated at point
M. The circular insets represent
the geometry of the deformed
specimen at various points along
the curve. F
Stress
Strain
11
and fracture ultimately occurs at the neck. The fracture strength corresponds to the
stress at fracture.
Tensile strengths vary from 50 MPa (7000 psi) for an aluminum to as high as 3000
MPa (450,000 psi) for the high-strength steels. Typically, when the strength of a metal
is cited for design purposes, the yield strength is used because by the time a stress cor-
responding to the tensile strength has been applied, often a structure has experienced
so much plastic deformation that it is useless. Furthermore, fracture strengths are not
normally specified for engineering design purposes.
EXAMPLE PROBLEM 6.3
Mechanical Property Determinations from Stress–Strain Plot
From the tensile stress–strain behavior for the brass specimen shown in Figure 6.12, determine
the following:
(a) The modulus of elasticity
(b) The yield strength at a strain offset of 0.002
(c) The maximum load that can be sustained by a cylindrical specimen having an original
diameter of 12.8 mm (0.505 in.)
(d) The change in length of a specimen originally 250 mm (10 in.) long that is subjected to a
tensile stress of 345 MPa (50,000 psi)
Solution
(a) The modulus of elasticity is the slope of the elastic or initial linear portion of the stress–
strain curve. The strain axis has been expanded in the inset of Figure 6.12 to facilitate
11 The apparent decrease in engineering stress with continued deformation past the maximum point of Figure 6.11 is
due to the necking phenomenon. As explained in Section 6.7, the true stress (within the neck) actually increases.