
Page 224 - Materials Science and Engineering An Introduction
P. 224
196 • Chapter 6 / Mechanical Properties of Metals
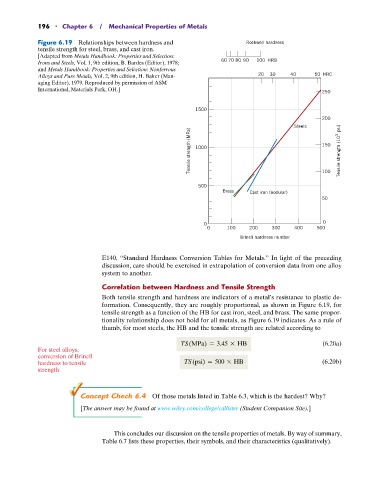
Figure 6.19 Relationships between hardness and Rockwell hardness
tensile strength for steel, brass, and cast iron.
[Adapted from Metals Handbook: Properties and Selection:
Irons and Steels, Vol. 1, 9th edition, B. Bardes (Editor), 1978; 60 70 80 90 100 HRB
and Metals Handbook: Properties and Selection: Nonferrous
Alloys and Pure Metals, Vol. 2, 9th edition, H. Baker (Man- 20 30 40 50 HRC
aging Editor), 1979. Reproduced by permission of ASM
International, Materials Park, OH.]
250
1500
200
Steels
Tensile strength (MPa) 1000 150 Tensile strength (10 3 psi)
500 100
Brass Cast iron (nodular)
50
0 0
0 100 200 300 400 500
Brinell hardness number
E140, “Standard Hardness Conversion Tables for Metals.” In light of the preceding
discussion, care should be exercised in extrapolation of conversion data from one alloy
system to another.
Correlation between Hardness and Tensile Strength
Both tensile strength and hardness are indicators of a metal’s resistance to plastic de-
formation. Consequently, they are roughly proportional, as shown in Figure 6.19, for
tensile strength as a function of the HB for cast iron, steel, and brass. The same propor-
tionality relationship does not hold for all metals, as Figure 6.19 indicates. As a rule of
thumb, for most steels, the HB and the tensile strength are related according to
TS (MPa) = 3.45 * HB (6.20a)
For steel alloys,
conversion of Brinell
hardness to tensile TS (psi) = 500 * HB (6.20b)
strength
Concept Check 6.4 Of those metals listed in Table 6.3, which is the hardest? Why?
[The answer may be found at www.wiley.com/college/callister (Student Companion Site).]
This concludes our discussion on the tensile properties of metals. By way of summary,
Table 6.7 lists these properties, their symbols, and their characteristics (qualitatively).