
Page 225 - Materials Science and Engineering An Introduction
P. 225
6.11 Variability of Material Properties • 197
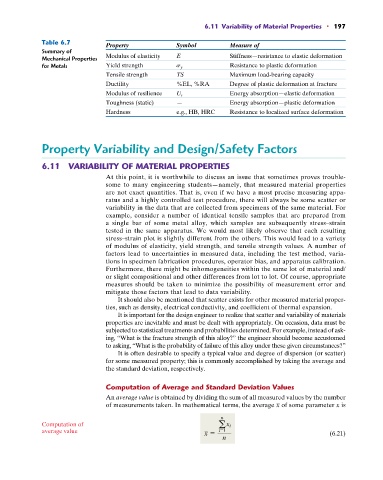
Table 6.7
Property Symbol Measure of
Summary of
Mechanical Properties Modulus of elasticity E Stiffness—resistance to elastic deformation
for Metals Yield strength s y Resistance to plastic deformation
Tensile strength TS Maximum load-bearing capacity
Ductility %EL, %RA Degree of plastic deformation at fracture
Modulus of resilience U r Energy absorption—elastic deformation
Toughness (static) — Energy absorption—plastic deformation
Hardness e.g., HB, HRC Resistance to localized surface deformation
Property Variability and Design/Safety Factors
6.11 VARIABILITY OF MATERIAL PROPERTIES
At this point, it is worthwhile to discuss an issue that sometimes proves trouble-
some to many engineering students—namely, that measured material properties
are not exact quantities. That is, even if we have a most precise measuring appa-
ratus and a highly controlled test procedure, there will always be some scatter or
variability in the data that are collected from specimens of the same material. For
example, consider a number of identical tensile samples that are prepared from
a single bar of some metal alloy, which samples are subsequently stress–strain
tested in the same apparatus. We would most likely observe that each resulting
stress–strain plot is slightly different from the others. This would lead to a variety
of modulus of elasticity, yield strength, and tensile strength values. A number of
factors lead to uncertainties in measured data, including the test method, varia-
tions in specimen fabrication procedures, operator bias, and apparatus calibration.
Furthermore, there might be inhomogeneities within the same lot of material and/
or slight compositional and other differences from lot to lot. Of course, appropriate
measures should be taken to minimize the possibility of measurement error and
mitigate those factors that lead to data variability.
It should also be mentioned that scatter exists for other measured material proper-
ties, such as density, electrical conductivity, and coefficient of thermal expansion.
It is important for the design engineer to realize that scatter and variability of materials
properties are inevitable and must be dealt with appropriately. On occasion, data must be
subjected to statistical treatments and probabilities determined. For example, instead of ask-
ing, “What is the fracture strength of this alloy?” the engineer should become accustomed
to asking, “What is the probability of failure of this alloy under these given circumstances?”
It is often desirable to specify a typical value and degree of dispersion (or scatter)
for some measured property; this is commonly accomplished by taking the average and
the standard deviation, respectively.
Computation of Average and Standard Deviation Values
An average value is obtained by dividing the sum of all measured values by the number
of measurements taken. In mathematical terms, the average x of some parameter x is
n
Computation of a i
x
average value x = i=1 (6.21)
n