
Page 325 - Materials Science and Engineering An Introduction
P. 325
C h a p t e r 9 Phase Diagrams
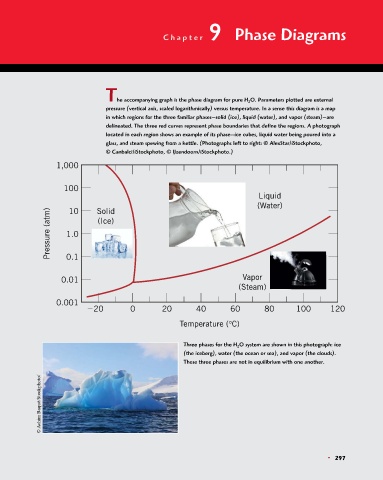
The accompanying graph is the phase diagram for pure H 2 O. Parameters plotted are external
pressure (vertical axis, scaled logarithmically) versus temperature. In a sense this diagram is a map
in which regions for the three familiar phases—solid (ice), liquid (water), and vapor (steam)—are
delineated. The three red curves represent phase boundaries that define the regions. A photograph
located in each region shows an example of its phase—ice cubes, liquid water being poured into a
glass, and steam spewing from a kettle. (Photographs left to right: © AlexStar/iStockphoto,
© Canbalci/iStockphoto, © IJzendoorn/iStockphoto.)
1,000
100
Liquid
(Water)
10
Solid
Pressure (atm) 1.0 (Ice)
0.1
0.01 Vapor
(Steam)
0.001
20 0 20 40 60 80 100 120
Temperature (°C)
Three phases for the H 2 O system are shown in this photograph: ice
(the iceberg), water (the ocean or sea), and vapor (the clouds).
These three phases are not in equilibrium with one another.
© Achim Baqué/Stockphoto/
• 297