
Page 330 - Materials Science and Engineering An Introduction
P. 330
302 • Chapter 9 / Phase Diagrams
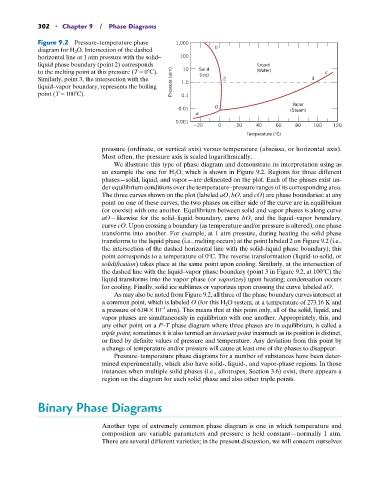
Figure 9.2 Pressure–temperature phase 1,000
diagram for H 2 O. Intersection of the dashed b
horizontal line at 1 atm pressure with the solid– 100
liquid phase boundary (point 2) corresponds Liquid
to the melting point at this pressure (T = 0 C). 10 Solid (Water) c
Similarly, point 3, the intersection with the (Ice) 2 3
liquid–vapor boundary, represents the boiling Pressure (atm) 1.0
point (T = 100 C). 0.1
Vapor
0.01 O (Steam)
a
0.001
20 0 20 40 60 80 100 120
Temperature (°C)
pressure (ordinate, or vertical axis) versus temperature (abscissa, or horizontal axis).
Most often, the pressure axis is scaled logarithmically.
We illustrate this type of phase diagram and demonstrate its interpretation using as
an example the one for H 2 O, which is shown in Figure 9.2. Regions for three different
phases—solid, liquid, and vapor—are delineated on the plot. Each of the phases exist un-
der equilibrium conditions over the temperature–pressure ranges of its corresponding area.
The three curves shown on the plot (labeled aO, bO, and cO) are phase boundaries; at any
point on one of these curves, the two phases on either side of the curve are in equilibrium
(or coexist) with one another. Equilibrium between solid and vapor phases is along curve
aO—likewise for the solid–liquid boundary, curve bO, and the liquid–vapor boundary,
curve cO. Upon crossing a boundary (as temperature and/or pressure is altered), one phase
transforms into another. For example, at 1 atm pressure, during heating the solid phase
transforms to the liquid phase (i.e., melting occurs) at the point labeled 2 on Figure 9.2 (i.e.,
the intersection of the dashed horizontal line with the solid–liquid phase boundary); this
point corresponds to a temperature of 0 C. The reverse transformation (liquid-to-solid, or
solidification) takes place at the same point upon cooling. Similarly, at the intersection of
the dashed line with the liquid–vapor phase boundary (point 3 in Figure 9.2, at 100 C) the
liquid transforms into the vapor phase (or vaporizes) upon heating; condensation occurs
for cooling. Finally, solid ice sublimes or vaporizes upon crossing the curve labeled aO.
As may also be noted from Figure 9.2, all three of the phase boundary curves intersect at
a common point, which is labeled O (for this H 2 O system, at a temperature of 273.16 K and
a pressure of 6.04 * 10 atm). This means that at this point only, all of the solid, liquid, and
-3
vapor phases are simultaneously in equilibrium with one another. Appropriately, this, and
any other point on a P–T phase diagram where three phases are in equilibrium, is called a
triple point; sometimes it is also termed an invariant point inasmuch as its position is distinct,
or fixed by definite values of pressure and temperature. Any deviation from this point by
a change of temperature and/or pressure will cause at least one of the phases to disappear.
Pressure–temperature phase diagrams for a number of substances have been deter-
mined experimentally, which also have solid-, liquid-, and vapor-phase regions. In those
instances when multiple solid phases (i.e., allotropes, Section 3.6) exist, there appears a
region on the diagram for each solid phase and also other triple points.
Binary Phase Diagrams
Another type of extremely common phase diagram is one in which temperature and
composition are variable parameters and pressure is held constant—normally 1 atm.
There are several different varieties; in the present discussion, we will concern ourselves