
Page 332 - Materials Science and Engineering An Introduction
P. 332
304 • Chapter 9 / Phase Diagrams
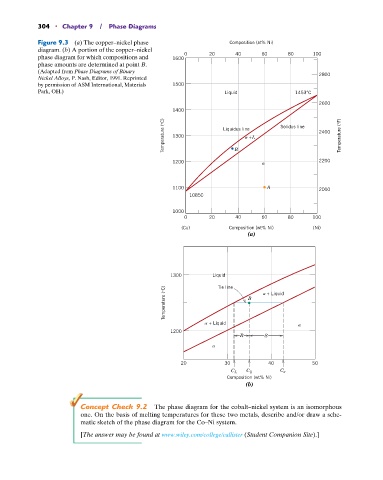
Figure 9.3 (a) The copper–nickel phase Composition (at% Ni)
diagram. (b) A portion of the copper–nickel
phase diagram for which compositions and 1600 0 20 40 60 80 100
phase amounts are determined at point B.
(Adapted from Phase Diagrams of Binary 2800
Nickel Alloys, P. Nash, Editor, 1991. Reprinted
by permission of ASM International, Materials 1500
Park, OH.) Liquid 1453°C
2600
1400
Temperature (°C) 1300 Liquidus line + L Solidus line 2400 Temperature (°F)
1200 B 2200
1100 A 2000
1085C
1000
0 20 40 60 80 100
(Cu) Composition (wt% Ni) (Ni)
(a)
1300 Liquid
Tie line
Temperature (°C) B + Liquid
+ Liquid
1200
R S
20 30 40 50
C
C L 0 C
Composition (wt% Ni)
(b)
Concept Check 9.2 The phase diagram for the cobalt–nickel system is an isomorphous
one. On the basis of melting temperatures for these two metals, describe and/or draw a sche-
matic sketch of the phase diagram for the Co–Ni system.
[The answer may be found at www.wiley.com/college/callister (Student Companion Site).]