
Page 337 - Materials Science and Engineering An Introduction
P. 337
9.9 Development of Microstructure in Isomorphous Alloys • 309
In these expressions, r a and r b are the densities of the respective phases; these may be
determined approximately using Equations 4.10a and 4.10b.
When the densities of the phases in a two-phase alloy differ significantly, there will
be quite a disparity between mass and volume fractions; conversely, if the phase densi-
ties are the same, mass and volume fractions are identical.
9.9 DEVELOPMENT OF MICROSTRUCTURE
IN ISOMORPHOUS ALLOYS
Equilibrium Cooling
At this point it is instructive to examine the development of microstructure that
occurs for isomorphous alloys during solidification. We first treat the situation
in which the cooling occurs very slowly, in that phase equilibrium is continuously
maintained.
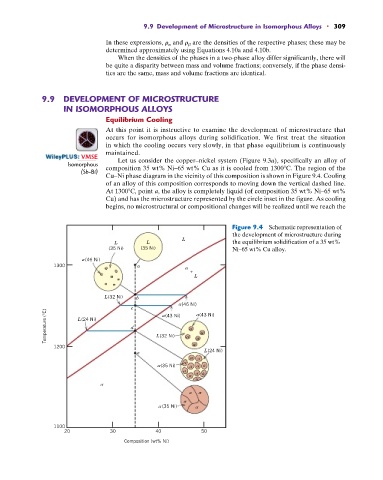
: VMSE Let us consider the copper–nickel system (Figure 9.3a), specifically an alloy of
Isomorphous composition 35 wt% Ni–65 wt% Cu as it is cooled from 1300 C. The region of the
(Sb-Bi)
Cu–Ni phase diagram in the vicinity of this composition is shown in Figure 9.4. Cooling
of an alloy of this composition corresponds to moving down the vertical dashed line.
At 1300 C, point a, the alloy is completely liquid (of composition 35 wt% Ni–65 wt%
Cu) and has the microstructure represented by the circle inset in the figure. As cooling
begins, no microstructural or compositional changes will be realized until we reach the
Figure 9.4 Schematic representation of
the development of microstructure during
L
L L the equilibrium solidification of a 35 wt%
(35 Ni) (35 Ni) Ni–65 wt% Cu alloy.
(46 Ni)
1300 a
+
L
L (32 Ni) b
(46 Ni)
c (43 Ni) (43 Ni)
Temperature (°C) L (24 Ni) d L (32 Ni)
1200
L (24 Ni)
e
(35 Ni)
(35 Ni)
1100
20 30 40 50
Composition (wt% Ni)