
Page 340 - Materials Science and Engineering An Introduction
P. 340
312 • Chapter 9 / Phase Diagrams
proportion of liquid remaining, and the a phase that is forming has a composition of
35 wt% Ni [a(35 Ni)]; also the average a-phase composition at this point is 38 wt%
Ni [a(38 Ni)].
Nonequilibrium solidification finally reaches completion at point e¿ (~1205 C). The
composition of the last a phase to solidify at this point is about 31 wt% Ni; the average
composition of the a phase at complete solidification is 35 wt% Ni. The inset at point f¿
shows the microstructure of the totally solid material.
The degree of displacement of the nonequilibrium solidus curve from the equilib-
rium one depends on the rate of cooling; the slower the cooling rate, the smaller this
displacement—that is, the difference between the equilibrium solidus and average solid
composition is lower. Furthermore, if the diffusion rate in the solid phase increases, this
displacement decreases.
There are some important consequences for isomorphous alloys that have solidi-
fied under nonequilibrium conditions. As discussed earlier, the distribution of the two
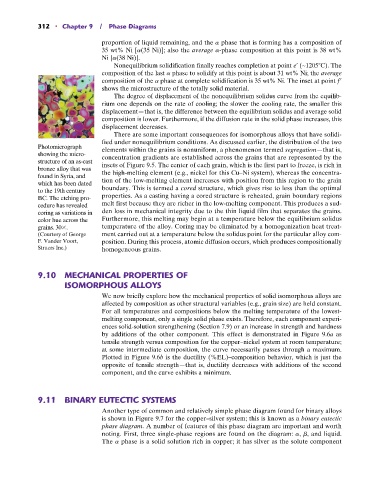
Photomicrograph elements within the grains is nonuniform, a phenomenon termed segregation—that is,
showing the micro- concentration gradients are established across the grains that are represented by the
structure of an as-cast insets of Figure 9.5. The center of each grain, which is the first part to freeze, is rich in
bronze alloy that was the high-melting element (e.g., nickel for this Cu–Ni system), whereas the concentra-
found in Syria, and
which has been dated tion of the low-melting element increases with position from this region to the grain
to the 19th century boundary. This is termed a cored structure, which gives rise to less than the optimal
BC. The etching pro- properties. As a casting having a cored structure is reheated, grain boundary regions
cedure has revealed melt first because they are richer in the low-melting component. This produces a sud-
coring as variations in den loss in mechanical integrity due to the thin liquid film that separates the grains.
color hue across the Furthermore, this melting may begin at a temperature below the equilibrium solidus
grains. 30 . temperature of the alloy. Coring may be eliminated by a homogenization heat treat-
(Courtesy of George ment carried out at a temperature below the solidus point for the particular alloy com-
F. Vander Voort, position. During this process, atomic diffusion occurs, which produces compositionally
Struers Inc.) homogeneous grains.
9.10 MECHANICAL PROPERTIES OF
ISOMORPHOUS ALLOYS
We now briefly explore how the mechanical properties of solid isomorphous alloys are
affected by composition as other structural variables (e.g., grain size) are held constant.
For all temperatures and compositions below the melting temperature of the lowest-
melting component, only a single solid phase exists. Therefore, each component experi-
ences solid-solution strengthening (Section 7.9) or an increase in strength and hardness
by additions of the other component. This effect is demonstrated in Figure 9.6a as
tensile strength versus composition for the copper–nickel system at room temperature;
at some intermediate composition, the curve necessarily passes through a maximum.
Plotted in Figure 9.6b is the ductility (%EL)–composition behavior, which is just the
opposite of tensile strength—that is, ductility decreases with additions of the second
component, and the curve exhibits a minimum.
9.11 BINARY EUTECTIC SYSTEMS
Another type of common and relatively simple phase diagram found for binary alloys
is shown in Figure 9.7 for the copper–silver system; this is known as a binary eutectic
phase diagram. A number of features of this phase diagram are important and worth
noting. First, three single-phase regions are found on the diagram: a, b, and liquid.
The a phase is a solid solution rich in copper; it has silver as the solute component