
Page 344 - Materials Science and Engineering An Introduction
P. 344
316 • Chapter 9 / Phase Diagrams
Concept Check 9.5 At 700 C (1290 F), what is the maximum solubility (a) of Cu in Ag?
(b) Of Ag in Cu?
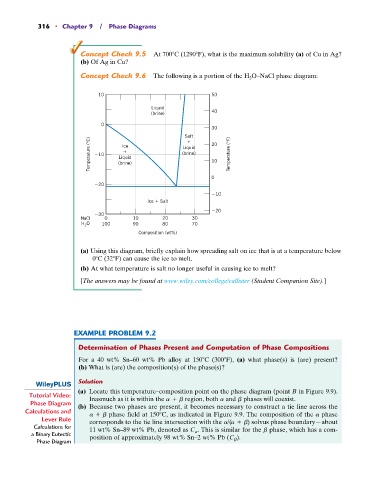
Concept Check 9.6 The following is a portion of the H 2 O–NaCl phase diagram:
10 50
Liquid
(brine) 40
0
30
Salt 20
Temperature (°C) 10 Liquid Liquid 10 Temperature (°F)
Ice
(brine)
(brine)
0
20
10
Ice Salt
20
30
NaCl 0 10 20 30
O
H 2 100 90 80 70
Composition (wt%)
(a) Using this diagram, briefly explain how spreading salt on ice that is at a temperature below
0 C (32 F) can cause the ice to melt.
(b) At what temperature is salt no longer useful in causing ice to melt?
[The answers may be found at www.wiley.com/college/callister (Student Companion Site).]
EXAMPLE PROBLEM 9.2
Determination of Phases Present and Computation of Phase Compositions
For a 40 wt% Sn–60 wt% Pb alloy at 150 C (300 F), (a) what phase(s) is (are) present?
(b) What is (are) the composition(s) of the phase(s)?
Solution
(a) Locate this temperature–composition point on the phase diagram (point B in Figure 9.9).
Tutorial Video: Inasmuch as it is within the a + b region, both a and b phases will coexist.
Phase Diagram (b) Because two phases are present, it becomes necessary to construct a tie line across the
Calculations and a + b phase field at 150 C, as indicated in Figure 9.9. The composition of the a phase
Lever Rule corresponds to the tie line intersection with the a/(a + b) solvus phase boundary—about
Calculations for 11 wt% Sn–89 wt% Pb, denoted as C a . This is similar for the b phase, which has a com-
a Binary Eutectic position of approximately 98 wt% Sn–2 wt% Pb (C b ).
Phase Diagram