
Page 348 - Materials Science and Engineering An Introduction
P. 348
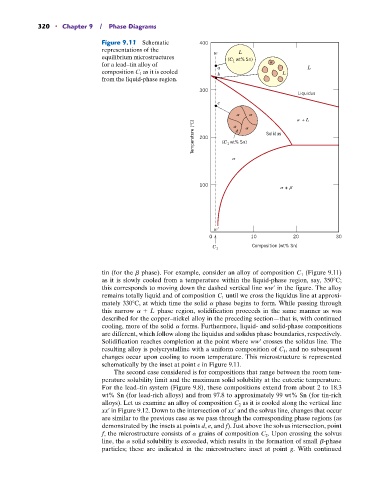
320   •  Chapter 9  /  Phase Diagrams

                                Figure 9.11  Schematic       400
                                  representations of the                 L
                                 equilibrium microstructures     w       wt% Sn)
                                for a lead–tin alloy of              (C 1
                                composition C 1  as it is cooled   a b                L      L
                                from the liquid-phase region.

                                                             300
                                                                                          Liquidus
                                                                  c
                                                                                            + L
                                                           Temperature (°C)  200  (C  wt% Sn)    Solidus


                                                                     1


                                                             100
                                                                                       +


                                                                 w
                                                                0 0         10           20           30
                                                                 C 1         Composition (wt% Sn)


                                tin (for the b  phase). For example, consider an alloy of composition C 1  (Figure 9.11)
                                as it is slowly cooled from a temperature within the liquid-phase region, say, 350 C;
                                this corresponds to moving down the dashed vertical line ww¿ in the figure. The alloy
                                remains totally liquid and of composition C 1  until we cross the liquidus line at approxi-
                                mately 330 C, at which time the solid a  phase begins to form. While passing through
                                this narrow a + L  phase region, solidification proceeds in the same manner as was
                                described for the copper–nickel alloy in the preceding section—that is, with continued
                                cooling, more of the solid a forms. Furthermore, liquid- and solid-phase compositions
                                are different, which follow along the liquidus and solidus phase boundaries, respectively.
                                Solidification reaches completion at the point where ww¿ crosses the solidus line. The
                                resulting alloy is polycrystalline with a uniform composition of C 1 , and no subsequent
                                changes occur upon cooling to room temperature. This microstructure is represented
                                schematically by the inset at point c in Figure 9.11.
                                   The second case considered is for compositions that range between the room tem-
                                perature solubility limit and the maximum solid solubility at the eutectic temperature.
                                For the lead–tin system (Figure 9.8), these compositions extend from about 2 to 18.3
                                wt% Sn (for lead-rich alloys) and from 97.8 to approximately 99 wt% Sn (for tin-rich
                                alloys). Let us examine an alloy of composition C 2  as it is cooled along the vertical line
                                xx¿ in Figure 9.12. Down to the intersection of xx¿ and the solvus line, changes that occur
                                are similar to the previous case as we pass through the corresponding phase regions (as
                                demonstrated by the insets at points d, e, and f). Just above the solvus intersection, point
                                f, the microstructure consists of a grains of composition C 2 . Upon crossing the solvus
                                line, the a solid solubility is exceeded, which results in the formation of small b-phase
                                particles; these are indicated in the microstructure inset at point g. With continued