
Page 352 - Materials Science and Engineering An Introduction
P. 352
324 • Chapter 9 / Phase Diagrams
300
L
Temperature (°C) 200 + L Q R + L
P
50 m
100
Figure 9.17 Photomicrograph showing the
microstructure of a lead–tin alloy of composition
50 wt% Sn–50 wt% Pb. This microstructure is 0
composed of a primary lead-rich a phase (large (Pb) (Sn)
dark regions) within a lamellar eutectic structure 18.3 C 4 61.9 97.8
consisting of a tin-rich b phase (light layers) and a Composition (wt% Sn)
lead-rich a phase (dark layers). 400*.
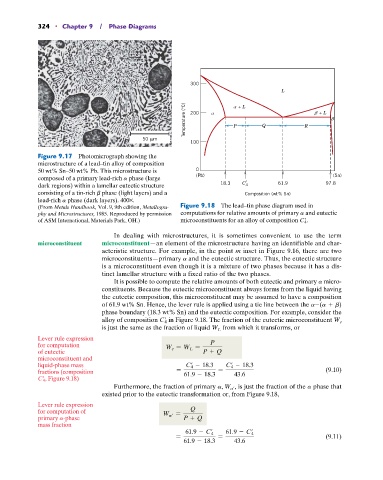
(From Metals Handbook, Vol. 9, 9th edition, Metallogra- Figure 9.18 The lead–tin phase diagram used in
phy and Microstructures, 1985. Reproduced by permission computations for relative amounts of primary a and eutectic
of ASM International, Materials Park, OH.) microconstituents for an alloy of composition C 4 .
In dealing with microstructures, it is sometimes convenient to use the term
microconstituent microconstituent—an element of the microstructure having an identifiable and char-
acteristic structure. For example, in the point m inset in Figure 9.16, there are two
microconstituents—primary a and the eutectic structure. Thus, the eutectic structure
is a microconstituent even though it is a mixture of two phases because it has a dis-
tinct lamellar structure with a fixed ratio of the two phases.
It is possible to compute the relative amounts of both eutectic and primary a micro-
constituents. Because the eutectic microconstituent always forms from the liquid having
the eutectic composition, this microconstituent may be assumed to have a composition
of 61.9 wt% Sn. Hence, the lever rule is applied using a tie line between the a-(a + b)
phase boundary (18.3 wt% Sn) and the eutectic composition. For example, consider the
alloy of composition C 4 in Figure 9.18. The fraction of the eutectic microconstituent W e
is just the same as the fraction of liquid W L from which it transforms, or
Lever rule expression
for computation W e = W L = P
of eutectic P + Q
microconstituent and
liquid-phase mass C 4 - 18.3 C 4 - 18.3
fractions (composition = 61.9 - 18.3 = 43.6 (9.10)
C 4 , Figure 9.18)
Furthermore, the fraction of primary a, W a , is just the fraction of the a phase that
existed prior to the eutectic transformation or, from Figure 9.18,
Lever rule expression
for computation of W a = Q
primary a-phase P + Q
mass fraction
= 61.9 - C 4 = 61.9 - C 4 (9.11)
61.9 - 18.3 43.6