
Page 354 - Materials Science and Engineering An Introduction
P. 354
2200 2000 1800 1600 1400 1200 Temperature (°F) 1000 800 600 400
100 100 (Zn)
+ L
+
L
+
Liquid
80 + L 80
+
L +
+ +
60 L 60
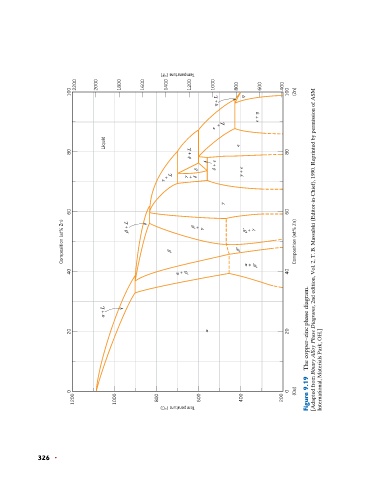
Composition (at% Zn) + + + Composition (wt% Zn) [Adapted from Binary Alloy Phase Diagrams, 2nd edition, Vol. 2, T. B. Massalski (Editor-in-Chief), 1990. Reprinted by permission of ASM
+
40 + 40
The copper–zinc phase diagram.
+ L
20 20
0 0 (Cu) Figure 9.19 International, Materials Park, OH.]
1200 1000 800 Temperature (°C) 600 400 200
326 •