Page 355 - Materials Science and Engineering An Introduction
P. 355

9.13  Equilibrium Diagrams Having Intermediate Phases or Compounds  •  327


                                                               Composition (at% Pb)
                                        0                 5         10          20    30  40    70 100
                                     700
                                                                       L
                                                                                                    1200
                                                                                   L
                                     600
                                                                                   +
                                                                                  Mg Pb  M
                                                             +  L                  2
                                                                                                    1000
                                     500
                                  Temperature (°C)  400                                   Mg Pb     800   Temperature (°F)
                                                                                            L
                                                                                                 +
                                                                                            +
                                                                                                 L
                                                                                            2
                                                                                                    600
                                     300
                                     200                                                            400
                                                                        + Mg Pb
                                                                         2
                                                                                                +
                                     100                                                    Mg Pb   200
                                                                                             2
                                                                                  Pb
                                                                               Mg 2
                                      0
                                       0           20          40          60          80          100
                                       (Mg)                    Composition (wt% Pb)                (Pb)
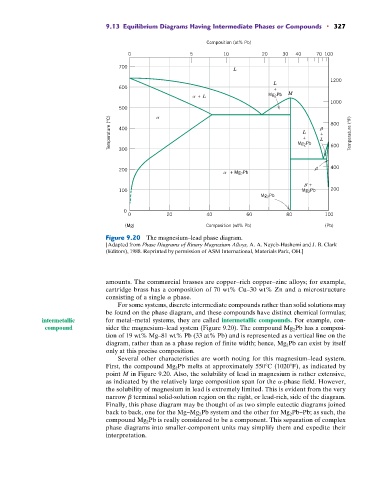
                                 Figure 9.20  The magnesium–lead phase diagram.
                                 [Adapted from Phase Diagrams of Binary Magnesium Alloys, A. A. Nayeb-Hashemi and J. B. Clark
                                 (Editors), 1988. Reprinted by permission of ASM International, Materials Park, OH.]


                                 amounts. The commercial brasses are copper–rich copper–zinc alloys; for example,
                                 cartridge brass has a composition of 70 wt% Cu–30 wt% Zn and a microstructure
                                 consisting of a single a phase.
                                    For some systems, discrete intermediate compounds rather than solid solutions may
                                 be found on the phase diagram, and these compounds have distinct chemical formulas;
              intermetallic      for metal–metal systems, they are called intermetallic compounds.  For example, con-
               compound          sider the magnesium–lead system (Figure 9.20). The compound Mg 2 Pb has a composi-
                                 tion of 19 wt% Mg–81 wt% Pb (33 at% Pb) and is represented as a vertical line on the
                                 diagram, rather than as a phase region of finite width; hence, Mg 2 Pb can exist by itself
                                 only at this precise composition.
                                    Several other characteristics are worth noting for this magnesium–lead system.
                                 First, the compound Mg 2 Pb melts at approximately 550 C (1020 F), as indicated by
                                 point M in Figure 9.20. Also, the solubility of lead in magnesium is rather extensive,
                                 as indicated by the relatively large composition span for the a-phase field. However,
                                 the solubility of magnesium in lead is extremely limited. This is evident from the very
                                 narrow b terminal solid-solution region on the right, or lead-rich, side of the diagram.
                                 Finally, this phase diagram may be thought of as two simple eutectic diagrams joined
                                 back to back, one for the Mg–Mg 2 Pb system and the other for Mg 2 Pb–Pb; as such, the
                                 compound Mg 2 Pb is really considered to be a component. This separation of complex
                                 phase diagrams into smaller-component units may simplify them and expedite their
                                 interpretation.
   350   351   352   353   354   355   356   357   358   359   360