
Page 357 - Materials Science and Engineering An Introduction
P. 357
9.15 Congruent Phase Transformations • 329
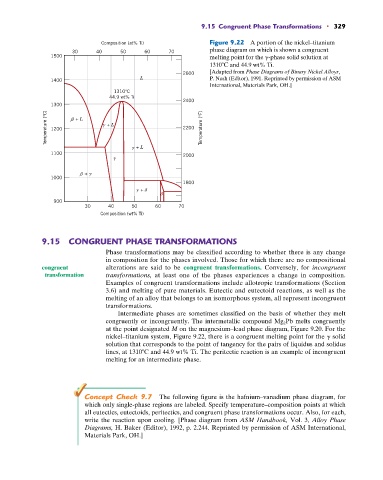
Composition (at% Ti) Figure 9.22 A portion of the nickel–titanium
phase diagram on which is shown a congruent
30 40 50 60 70
1500 melting point for the g-phase solid solution at
1310 C and 44.9 wt% Ti.
[Adapted from Phase Diagrams of Binary Nickel Alloys,
2600
L P. Nash (Editor), 1991. Reprinted by permission of ASM
1400
International, Materials Park, OH.]
1310°C
44.9 wt% Ti
2400
1300
Temperature (°C) 1200 + L + L 2200 Temperature (°F)
+ L
1100 2000
+
1000
1800
+
900
30 40 50 60 70
Composition (wt% Ti)
9.15 CONGRUENT PHASE TRANSFORMATIONS
Phase transformations may be classified according to whether there is any change
in composition for the phases involved. Those for which there are no compositional
congruent alterations are said to be congruent transformations. Conversely, for incongruent
transformation transformations, at least one of the phases experiences a change in composition.
Examples of congruent transformations include allotropic transformations (Section
3.6) and melting of pure materials. Eutectic and eutectoid reactions, as well as the
melting of an alloy that belongs to an isomorphous system, all represent incongruent
transformations.
Intermediate phases are sometimes classified on the basis of whether they melt
congruently or incongruently. The intermetallic compound Mg 2 Pb melts congruently
at the point designated M on the magnesium–lead phase diagram, Figure 9.20. For the
nickel–titanium system, Figure 9.22, there is a congruent melting point for the g solid
solution that corresponds to the point of tangency for the pairs of liquidus and solidus
lines, at 1310 C and 44.9 wt% Ti. The peritectic reaction is an example of incongruent
melting for an intermediate phase.
Concept Check 9.7 The following figure is the hafnium–vanadium phase diagram, for
which only single-phase regions are labeled. Specify temperature–composition points at which
all eutectics, eutectoids, peritectics, and congruent phase transformations occur. Also, for each,
write the reaction upon cooling. [Phase diagram from ASM Handbook, Vol. 3, Alloy Phase
Diagrams, H. Baker (Editor), 1992, p. 2.244. Reprinted by permission of ASM International,
Materials Park, OH.]