
Page 358 - Materials Science and Engineering An Introduction
P. 358
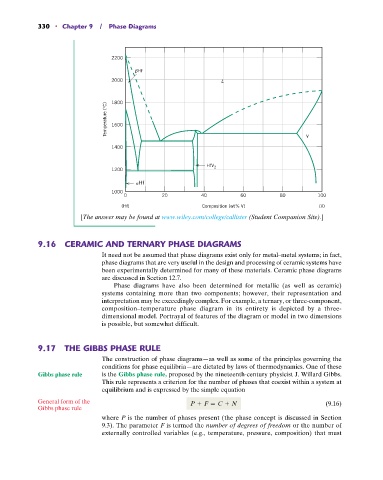
330   •  Chapter 9  /  Phase Diagrams


                                   2200

                                           Hf
                                   2000                            L


                                 Temperature (°C)  1800


                                   1600


                                   1400                                                      V


                                                               HfV
                                   1200                          2
                                           Hf
                                   1000
                                      0           20         40          60          80         100
                                     (Hf)                     Composition (wt% V)                (V)
                         [The answer may be found at www.wiley.com/college/callister (Student Companion Site).]


            9.16  CERAMIC AND TERNARY PHASE DIAGRAMS
                                It need not be assumed that phase diagrams exist only for metal–metal systems; in fact,
                                phase diagrams that are very useful in the design and processing of ceramic systems have
                                been experimentally determined for many of these materials. Ceramic phase diagrams
                                are discussed in Section 12.7.
                                   Phase diagrams have also been determined for metallic (as well as ceramic)
                                systems containing more than two components; however, their representation and
                                interpretation may be exceedingly complex. For example, a ternary, or three-component,
                                composition–temperature phase diagram in its entirety is depicted by a three-
                                dimensional model. Portrayal of features of the diagram or model in two dimensions
                                is possible, but somewhat difficult.


            9.17  THE GIBBS PHASE RULE

                                The construction of phase diagrams—as well as some of the principles governing the
                                conditions for phase equilibria—are dictated by laws of thermodynamics. One of these
            Gibbs phase rule    is the Gibbs phase rule, proposed by the nineteenth-century physicist J. Willard Gibbs.
                                This rule represents a criterion for the number of phases that coexist within a system at
                                equilibrium and is expressed by the simple equation

            General form of the                           P + F = C + N                            (9.16)
            Gibbs phase rule
                                where P is the number of phases present (the phase concept is discussed in Section
                                9.3). The parameter F is termed the number of degrees of freedom or the number of
                                externally controlled variables (e.g., temperature, pressure, composition) that must