
Page 362 - Materials Science and Engineering An Introduction
P. 362
334 • Chapter 9 / Phase Diagrams
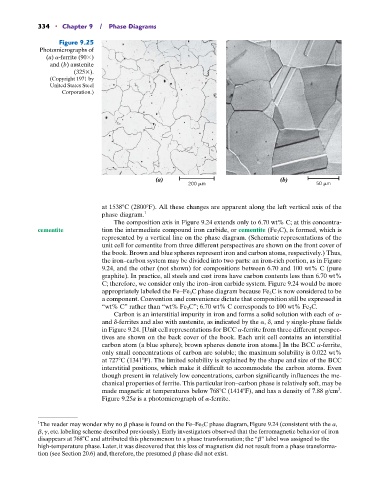
Figure 9.25
Photomicrographs of
(a) a-ferrite (90 )
and (b) austenite
(325 ).
(Copyright 1971 by
United States Steel
Corporation.)
(a) (b)
at 1538 C (2800 F). All these changes are apparent along the left vertical axis of the
phase diagram. 1
The composition axis in Figure 9.24 extends only to 6.70 wt% C; at this concentra-
cementite tion the intermediate compound iron carbide, or cementite (Fe 3 C), is formed, which is
represented by a vertical line on the phase diagram. (Schematic representations of the
unit cell for cementite from three different perspectives are shown on the front cover of
the book. Brown and blue spheres represent iron and carbon atoms, respectively.) Thus,
the iron–carbon system may be divided into two parts: an iron-rich portion, as in Figure
9.24, and the other (not shown) for compositions between 6.70 and 100 wt% C (pure
graphite). In practice, all steels and cast irons have carbon contents less than 6.70 wt%
C; therefore, we consider only the iron–iron carbide system. Figure 9.24 would be more
appropriately labeled the Fe–Fe 3 C phase diagram because Fe 3 C is now considered to be
a component. Convention and convenience dictate that composition still be expressed in
“wt% C” rather than “wt% Fe 3 C”; 6.70 wt% C corresponds to 100 wt% Fe 3 C.
Carbon is an interstitial impurity in iron and forms a solid solution with each of a-
and d-ferrites and also with austenite, as indicated by the a, d, and g single-phase fields
in Figure 9.24. [Unit cell representations for BCC a-ferrite from three different perspec-
tives are shown on the back cover of the book. Each unit cell contains an interstitial
carbon atom (a blue sphere); brown spheres denote iron atoms.] In the BCC a-ferrite,
only small concentrations of carbon are soluble; the maximum solubility is 0.022 wt%
at 727 C (1341 F). The limited solubility is explained by the shape and size of the BCC
interstitial positions, which make it difficult to accommodate the carbon atoms. Even
though present in relatively low concentrations, carbon significantly influences the me-
chanical properties of ferrite. This particular iron–carbon phase is relatively soft, may be
3
made magnetic at temperatures below 768 C (1414 F), and has a density of 7.88 g/cm .
Figure 9.25a is a photomicrograph of a-ferrite.
1 The reader may wonder why no b phase is found on the Fe–Fe 3 C phase diagram, Figure 9.24 (consistent with the a,
b, g, etc. labeling scheme described previously). Early investigators observed that the ferromagnetic behavior of iron
disappears at 768 C and attributed this phenomenon to a phase transformation; the “b” label was assigned to the
high-temperature phase. Later, it was discovered that this loss of magnetism did not result from a phase transforma-
tion (see Section 20.6) and, therefore, the presumed b phase did not exist.