
Page 367 - Materials Science and Engineering An Introduction
P. 367
9.19 Development of Microstructure in Iron–Carbon Alloys • 339
entirely of grains of the g phase, as shown schematically in the figure. In cooling to
point d, about 775 C, which is within the a + g phase region, both these phases coexist
as in the schematic microstructure. Most of the small a particles form along the original
g grain boundaries. The compositions of both a and g phases may be determined using
the appropriate tie line; these compositions correspond, respectively, to about 0.020 and
0.40 wt% C.
While cooling an alloy through the a + g phase region, the composition of the fer-
rite phase changes with temperature along the a - (a + g) phase boundary, line MN,
Scanning electron becoming slightly richer in carbon. However, the change in composition of the austenite
micrograph showing is more dramatic, proceeding along the (a + g) - g boundary, line MO, as the tempera-
the microstructure of ture is reduced.
a steel that contains Cooling from point d to e, just above the eutectoid but still in the a + g region,
0.44 wt% C. The produces an increased fraction of the a phase and a microstructure similar to that also
large dark areas are shown: the a particles will have grown larger. At this point, the compositions of the
proeutectoid ferrite. a and g phases are determined by constructing a tie line at the temperature T e ; the
Regions having the a phase contains 0.022 wt% C, whereas the g phase is of the eutectoid composition,
alternating light and 0.76 wt% C.
dark lamellar struc- As the temperature is lowered just below the eutectoid, to point f, all of the
ture are pearlite; the (and having the eutectoid composi-
dark and light layers g phase that was present at temperature T e
tion) transforms into pearlite, according to the reaction in Equation 9.19. There is
in the pearlite cor- virtually no change in the a phase that existed at point e in crossing the eutectoid
respond, respectively, temperature—it is normally present as a continuous matrix phase surrounding
to ferrite and cement-
ite phases. 700 . the isolated pearlite colonies. The microstructure at point f appears as the cor-
(Micrograph courtesy responding schematic inset of Figure 9.29. Thus the ferrite phase is present both
of Republic Steel in the pearlite and as the phase that formed while cooling through the a + g phase
Corporation.) region. The ferrite present in the pearlite is called eutectoid ferrite, whereas the
other, which formed above T e , is termed proeutectoid (meaning “pre- or before
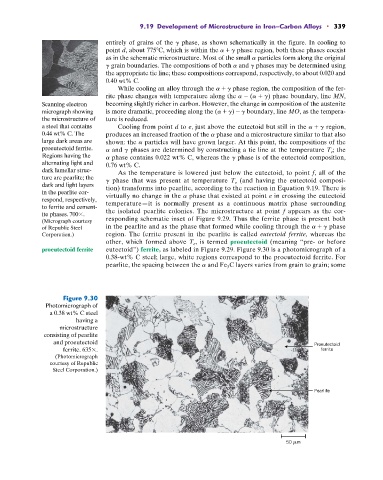
proeutectoid ferrite eutectoid”) ferrite, as labeled in Figure 9.29. Figure 9.30 is a photomicrograph of a
0.38-wt% C steel; large, white regions correspond to the proeutectoid ferrite. For
pearlite, the spacing between the a and Fe 3 C layers varies from grain to grain; some
Figure 9.30
Photomicrograph of
a 0.38 wt% C steel
having a
microstructure
consisting of pearlite
and proeutectoid Proeutectoid
ferrite. 635 . ferrite
(Photomicrograph
courtesy of Republic
Steel Corporation.)
Pearlite
50 m