Page 364 - Materials Science and Engineering An Introduction
P. 364

336   •  Chapter 9  /  Phase Diagrams

                                that contain between 0.008 and 2.14 wt% C are classified as steels. In most steels, the
                                microstructure consists of both a and Fe 3 C phases. Upon cooling to room temperature,
                                an alloy within this composition range must pass through at least a portion of the g-
                                phase field; distinctive microstructures are subsequently produced, as discussed shortly.
                                Although a steel alloy may contain as much as 2.14 wt% C, in practice, carbon concen-
                                trations rarely exceed 1.0 wt%. The properties and various classifications of steels are
                                treated in Section 11.2. Cast irons are classified as ferrous alloys that contain between
                                2.14 and 6.70 wt% C. However, commercial cast irons normally contain less than 4.5
                                wt% C. These alloys are discussed further in Section 11.2.

            9.19    DEVELOPMENT OF MICROSTRUCTURE IN
                    IRON–CARBON ALLOYS
                                Several of the various microstructures that may be produced in steel alloys and their
                                relationships to the iron–iron carbon phase diagram are now discussed, and it is shown
                                that the microstructure that develops depends on both the carbon content and heat
                                treatment. This discussion is confined to very slow cooling of steel alloys, in which equi-
                                librium is continuously maintained. A more detailed exploration of the influence of heat
                                treatment on microstructure, and ultimately on the mechanical properties of steels, is
                                contained in Chapter 10.
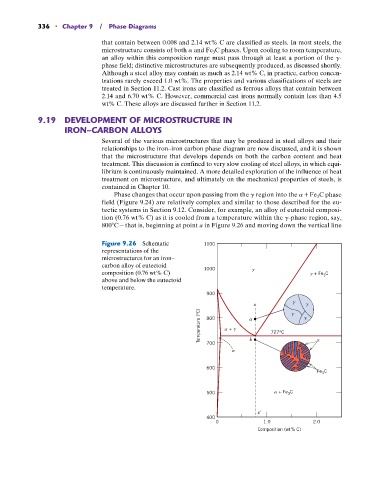
                                   Phase changes that occur upon passing from the g region into the a + Fe 3 C phase
                                field (Figure 9.24) are relatively complex and similar to those described for the eu-
                                tectic systems in Section 9.12. Consider, for example, an alloy of eutectoid composi-
                                tion (0.76 wt% C) as it is cooled from a temperature within the g-phase region, say,
                                800 C—that is, beginning at point a in Figure 9.26 and moving down the vertical line

                                Figure 9.26  Schematic        1100
                                representations of the
                                microstructures for an iron–
                                carbon alloy of eutectoid     1000
                                composition (0.76 wt% C)                                        + Fe C
                                                                                                  3
                                above and below the eutectoid
                                temperature.
                                                               900

                                                                             x
                                                             Temperature (°C)  800    +     a  727°C


                                                               700
                                                                            b


                                                               600
                                                                                                Fe C
                                                                                                  3
                                                               500                   + Fe C
                                                                                       3

                                                                              x
                                                               400
                                                                  0             1.0            2.0
                                                                              Composition (wt% C)
   359   360   361   362   363   364   365   366   367   368   369