
Page 366 - Materials Science and Engineering An Introduction
P. 366
338 • Chapter 9 / Phase Diagrams
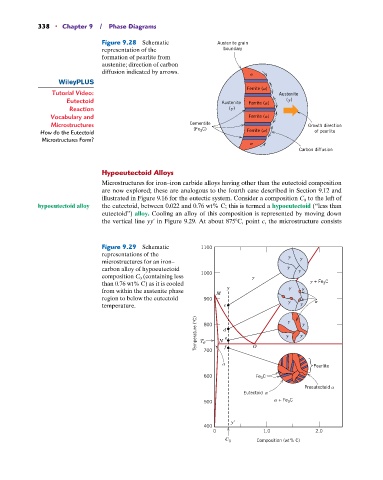
Figure 9.28 Schematic Austenite grain
representation of the boundary
formation of pearlite from
austenite; direction of carbon
diffusion indicated by arrows.
Ferrite ( )
Tutorial Video: Austenite
Eutectoid Austenite Ferrite ( ) ( )
Reaction ( )
Vocabulary and Ferrite ( )
Microstructures Cementite Growth direction
How do the Eutectoid (Fe 3 C) Ferrite ( ) of pearlite
Microstructures Form?
Carbon diffusion
Hypoeutectoid Alloys
Microstructures for iron–iron carbide alloys having other than the eutectoid composition
are now explored; these are analogous to the fourth case described in Section 9.12 and
illustrated in Figure 9.16 for the eutectic system. Consider a composition C 0 to the left of
hypoeutectoid alloy the eutectoid, between 0.022 and 0.76 wt% C; this is termed a hypoeutectoid (“less than
eutectoid”) alloy. Cooling an alloy of this composition is represented by moving down
the vertical line yy¿ in Figure 9.29. At about 875 C, point c, the microstructure consists
Figure 9.29 Schematic 1100
representations of the
microstructures for an iron–
carbon alloy of hypoeutectoid
composition C 0 (containing less 1000
than 0.76 wt% C) as it is cooled + Fe C
3
from within the austenite phase M y
region to below the eutectoid 900
temperature. c
Temperature (°C) T e 800 N d f e O
700
Pearlite
600 Fe 3 C
Proeutectoid
Eutectoid
+ Fe C
500 3
y
400
0 1.0 2.0
C 0 Composition (wt% C)