
Page 368 - Materials Science and Engineering An Introduction
P. 368
340 • Chapter 9 / Phase Diagrams
of the pearlite appears dark because the many close-spaced layers are unresolved
at the magnification of the photomicrograph. Note that two microconstituents are
present in this micrograph—proeutectoid ferrite and pearlite—which appear in all
hypoeutectoid iron–carbon alloys that are slowly cooled to a temperature below
the eutectoid.
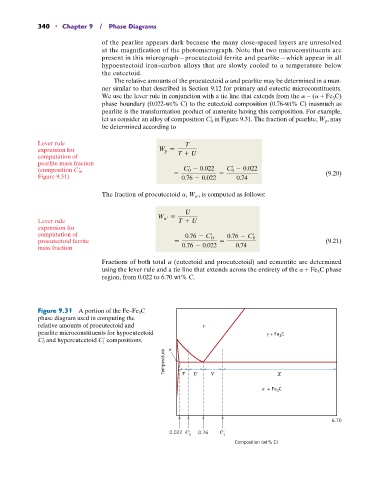
The relative amounts of the proeutectoid a and pearlite may be determined in a man-
ner similar to that described in Section 9.12 for primary and eutectic microconstituents.
We use the lever rule in conjunction with a tie line that extends from the a - (a + Fe 3 C)
phase boundary (0.022-wt% C) to the eutectoid composition (0.76-wt% C) inasmuch as
pearlite is the transformation product of austenite having this composition. For example,
let us consider an alloy of composition C 0 in Figure 9.31. The fraction of pearlite, W p , may
be determined according to
Lever rule T
expression for W p =
computation of T + U
pearlite mass fraction
(composition C 0 , C 0 - 0.022 C 0 - 0.022 (9.20)
Figure 9.31) = 0.76 - 0.022 = 0.74
The fraction of proeutectoid a, W a¿ , is computed as follows:
U
W a =
Lever rule T + U
expression for
computation of
proeutectoid ferrite = 0.76 - C 0 = 0.76 - C 0 (9.21)
mass fraction 0.76 - 0.022 0.74
Fractions of both total a (eutectoid and proeutectoid) and cementite are determined
using the lever rule and a tie line that extends across the entirety of the a + Fe 3 C phase
region, from 0.022 to 6.70 wt% C.
Figure 9.31 A portion of the Fe–Fe 3 C
phase diagram used in computing the
relative amounts of proeutectoid and
pearlite microconstituents for hypoeutectoid + Fe C
3
C 0 and hypereutectoid C 1 compositions.
Temperature T U V X
+ Fe C
3
6.70
0.022 C 0.76 C
0 1
Composition (wt% C)