
Page 370 - Materials Science and Engineering An Introduction
P. 370
342 • Chapter 9 / Phase Diagrams
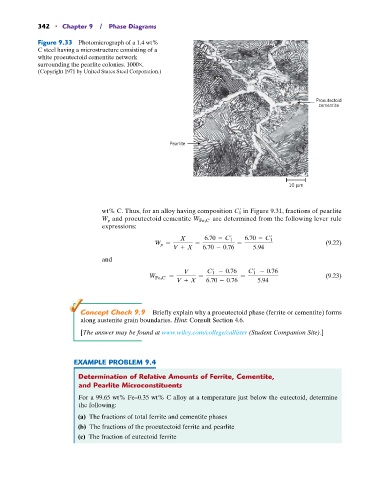
Figure 9.33 Photomicrograph of a 1.4 wt%
C steel having a microstructure consisting of a
white proeutectoid cementite network
surrounding the pearlite colonies. 1000*.
(Copyright 1971 by United States Steel Corporation.)
Proeutectoid
cementite
Pearlite
10 m
wt% C. Thus, for an alloy having composition C 1 in Figure 9.31, fractions of pearlite
W p and proeutectoid cementite W Fe 3 C are determined from the following lever rule
expressions:
X 6.70 - C 1 6.70 - C 1
W p = = = (9.22)
V + X 6.70 - 0.76 5.94
and
V C 1 - 0.76 C 1 - 0.76
W Fe 3 C = = = (9.23)
V + X 6.70 - 0.76 5.94
Concept Check 9.9 Briefly explain why a proeutectoid phase (ferrite or cementite) forms
along austenite grain boundaries. Hint: Consult Section 4.6.
[The answer may be found at www.wiley.com/college/callister (Student Companion Site).]
EXAMPLE PROBLEM 9.4
Determination of Relative Amounts of Ferrite, Cementite,
and Pearlite Microconstituents
For a 99.65 wt% Fe–0.35 wt% C alloy at a temperature just below the eutectoid, determine
the following:
(a) The fractions of total ferrite and cementite phases
(b) The fractions of the proeutectoid ferrite and pearlite
(c) The fraction of eutectoid ferrite