
Page 369 - Materials Science and Engineering An Introduction
P. 369
9.19 Development of Microstructure in Iron–Carbon Alloys • 341
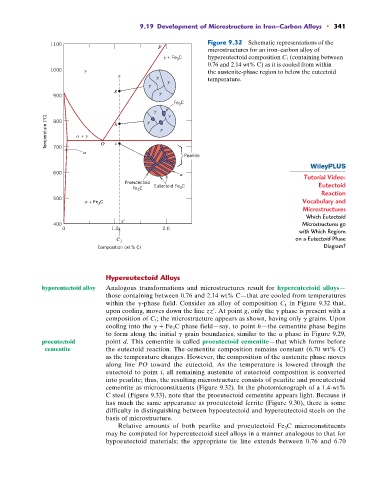
Figure 9.32 Schematic representations of the
1100
P
microstructures for an iron–carbon alloy of
+ Fe C hypereutectoid composition C 1 (containing between
3
0.76 and 2.14 wt% C) as it is cooled from within
1000 the austenite-phase region to below the eutectoid
z
temperature.
g
900
Fe C
3
Temperature (°C) + h
800
700
O i
Pearlite
600
Tutorial Video:
Proeutectoid
Eutectoid Fe C Eutectoid
Fe C 3
3
Reaction
500
+ Fe C Vocabulary and
3
Microstructures
Which Eutectoid
z'
400 Microstructures go
0 1.0 2.0
with Which Regions
C 1 on a Eutectoid Phase
Composition (wt% C) Diagram?
Hypereutectoid Alloys
hypereutectoid alloy Analogous transformations and microstructures result for hypereutectoid alloys—
those containing between 0.76 and 2.14 wt% C—that are cooled from temperatures
in Figure 9.32 that,
within the g-phase field. Consider an alloy of composition C 1
upon cooling, moves down the line zz¿. At point g, only the g phase is present with a
composition of C 1 ; the microstructure appears as shown, having only g grains. Upon
cooling into the g + Fe 3 C phase field—say, to point h—the cementite phase begins
to form along the initial g grain boundaries, similar to the a phase in Figure 9.29,
proeutectoid point d. This cementite is called proeutectoid cementite—that which forms before
cementite the eutectoid reaction. The cementite composition remains constant (6.70 wt% C)
as the temperature changes. However, the composition of the austenite phase moves
along line PO toward the eutectoid. As the temperature is lowered through the
eutectoid to point i, all remaining austenite of eutectoid composition is converted
into pearlite; thus, the resulting microstructure consists of pearlite and proeutectoid
cementite as microconstituents (Figure 9.32). In the photomicrograph of a 1.4-wt%
C steel (Figure 9.33), note that the proeutectoid cementite appears light. Because it
has much the same appearance as proeutectoid ferrite (Figure 9.30), there is some
difficulty in distinguishing between hypoeutectoid and hypereutectoid steels on the
basis of microstructure.
Relative amounts of both pearlite and proeutectoid Fe 3 C microconstituents
may be computed for hypereutectoid steel alloys in a manner analogous to that for
hypoeutectoid materials; the appropriate tie line extends between 0.76 and 6.70